Zip Codes with the Highest Percentage of Population Employed in Computer & Mathematics in Memphis, TN
RELATED REPORTS & OPTIONS
Computer & Mathematics
Memphis
Compare Zip Codes
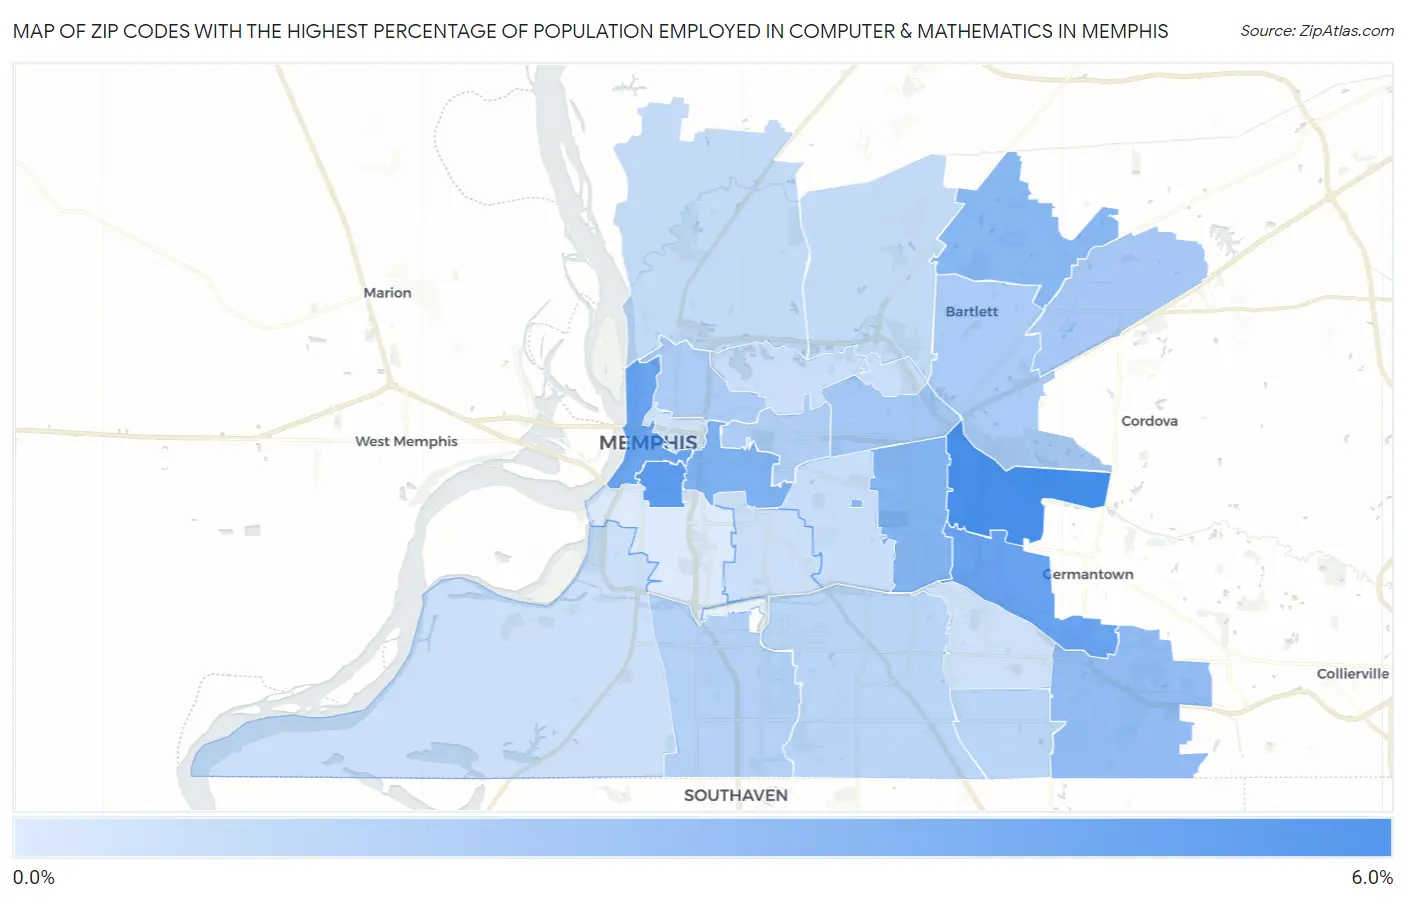
Map of Zip Codes with the Highest Percentage of Population Employed in Computer & Mathematics in Memphis
0.18%
5.5%
Zip Codes with the Highest Percentage of Population Employed in Computer & Mathematics in Memphis, TN
| Zip Code | % Employed | vs State | vs National | |
| 1. | 38120 | 5.5% | 2.6%(+2.91)#28 | 3.5%(+1.97)#2,791 |
| 2. | 38126 | 4.8% | 2.6%(+2.22)#38 | 3.5%(+1.28)#3,645 |
| 3. | 38119 | 4.3% | 2.6%(+1.74)#59 | 3.5%(+0.802)#4,383 |
| 4. | 38103 | 4.2% | 2.6%(+1.61)#65 | 3.5%(+0.669)#4,621 |
| 5. | 38104 | 3.5% | 2.6%(+0.890)#91 | 3.5%(-0.053)#6,275 |
| 6. | 38117 | 3.3% | 2.6%(+0.723)#96 | 3.5%(-0.220)#6,762 |
| 7. | 38135 | 3.1% | 2.6%(+0.561)#110 | 3.5%(-0.382)#7,286 |
| 8. | 38152 | 3.1% | 2.6%(+0.555)#112 | 3.5%(-0.387)#7,300 |
| 9. | 38125 | 2.9% | 2.6%(+0.293)#126 | 3.5%(-0.650)#8,194 |
| 10. | 38122 | 2.2% | 2.6%(-0.410)#185 | 3.5%(-1.35)#11,025 |
| 11. | 38133 | 2.1% | 2.6%(-0.502)#197 | 3.5%(-1.44)#11,433 |
| 12. | 38134 | 1.9% | 2.6%(-0.642)#211 | 3.5%(-1.58)#12,097 |
| 13. | 38107 | 1.9% | 2.6%(-0.677)#214 | 3.5%(-1.62)#12,267 |
| 14. | 38112 | 1.8% | 2.6%(-0.774)#219 | 3.5%(-1.72)#12,720 |
| 15. | 38116 | 1.6% | 2.6%(-0.975)#238 | 3.5%(-1.92)#13,765 |
| 16. | 38141 | 1.4% | 2.6%(-1.18)#258 | 3.5%(-2.12)#14,950 |
| 17. | 38118 | 1.4% | 2.6%(-1.19)#260 | 3.5%(-2.14)#15,016 |
| 18. | 38127 | 1.1% | 2.6%(-1.50)#308 | 3.5%(-2.45)#16,898 |
| 19. | 38128 | 1.1% | 2.6%(-1.53)#312 | 3.5%(-2.47)#17,047 |
| 20. | 38111 | 0.92% | 2.6%(-1.66)#329 | 3.5%(-2.60)#17,886 |
| 21. | 38108 | 0.81% | 2.6%(-1.77)#344 | 3.5%(-2.71)#18,566 |
| 22. | 38114 | 0.77% | 2.6%(-1.81)#349 | 3.5%(-2.75)#18,809 |
| 23. | 38109 | 0.74% | 2.6%(-1.84)#356 | 3.5%(-2.79)#19,031 |
| 24. | 38115 | 0.66% | 2.6%(-1.93)#368 | 3.5%(-2.87)#19,524 |
| 25. | 38105 | 0.59% | 2.6%(-1.99)#378 | 3.5%(-2.93)#19,934 |
| 26. | 38106 | 0.18% | 2.6%(-2.40)#428 | 3.5%(-3.34)#22,121 |
1
Common Questions
What are the Top 10 Zip Codes with the Highest Percentage of Population Employed in Computer & Mathematics in Memphis, TN?
Top 10 Zip Codes with the Highest Percentage of Population Employed in Computer & Mathematics in Memphis, TN are:
What zip code has the Highest Percentage of Population Employed in Computer & Mathematics in Memphis, TN?
38120 has the Highest Percentage of Population Employed in Computer & Mathematics in Memphis, TN with 5.5%.
What is the Percentage of Population Employed in Computer & Mathematics in Memphis, TN?
Percentage of Population Employed in Computer & Mathematics in Memphis is 2.0%.
What is the Percentage of Population Employed in Computer & Mathematics in Tennessee?
Percentage of Population Employed in Computer & Mathematics in Tennessee is 2.6%.
What is the Percentage of Population Employed in Computer & Mathematics in the United States?
Percentage of Population Employed in Computer & Mathematics in the United States is 3.5%.