Zip Codes with the Highest Percentage of Population Employed in Firefighting & Prevention in Memphis, TN
RELATED REPORTS & OPTIONS
Firefighting & Prevention
Memphis
Compare Zip Codes
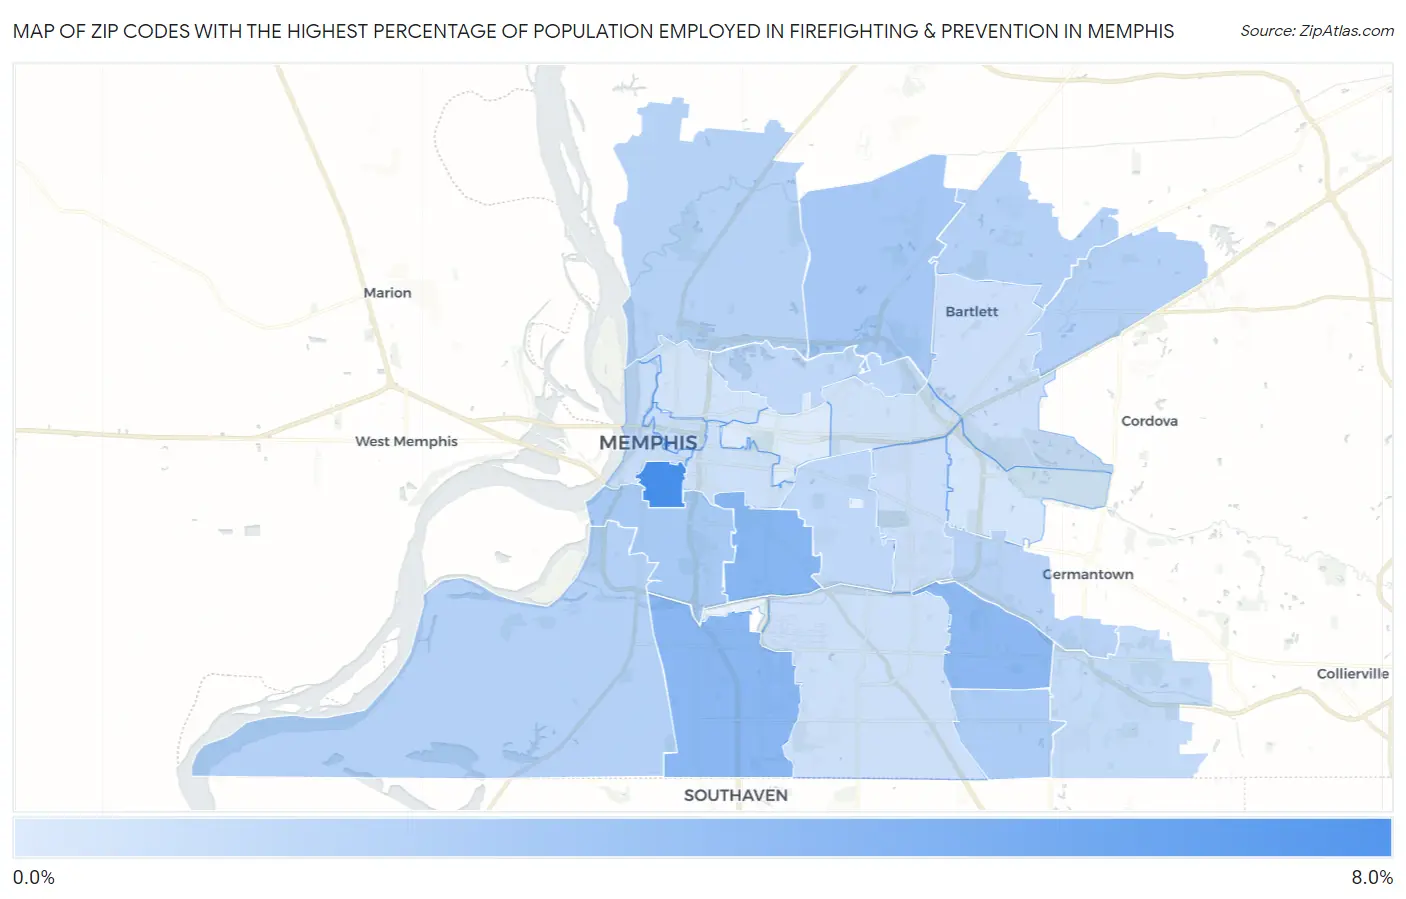
Map of Zip Codes with the Highest Percentage of Population Employed in Firefighting & Prevention in Memphis
0.44%
6.4%
Zip Codes with the Highest Percentage of Population Employed in Firefighting & Prevention in Memphis, TN
| Zip Code | % Employed | vs State | vs National | |
| 1. | 38126 | 6.4% | 1.1%(+5.25)#10 | 1.2%(+5.16)#615 |
| 2. | 38114 | 3.7% | 1.1%(+2.64)#20 | 1.2%(+2.55)#1,517 |
| 3. | 38116 | 3.7% | 1.1%(+2.56)#26 | 1.2%(+2.47)#1,592 |
| 4. | 38115 | 3.5% | 1.1%(+2.44)#28 | 1.2%(+2.35)#1,693 |
| 5. | 38128 | 2.6% | 1.1%(+1.45)#48 | 1.2%(+1.37)#2,985 |
| 6. | 38106 | 2.5% | 1.1%(+1.42)#51 | 1.2%(+1.34)#3,052 |
| 7. | 38141 | 2.3% | 1.1%(+1.17)#66 | 1.2%(+1.08)#3,667 |
| 8. | 38109 | 2.1% | 1.1%(+0.974)#75 | 1.2%(+0.886)#4,244 |
| 9. | 38135 | 2.1% | 1.1%(+0.957)#78 | 1.2%(+0.869)#4,313 |
| 10. | 38133 | 2.1% | 1.1%(+0.954)#80 | 1.2%(+0.866)#4,323 |
| 11. | 38127 | 1.9% | 1.1%(+0.843)#88 | 1.2%(+0.755)#4,741 |
| 12. | 38119 | 1.9% | 1.1%(+0.786)#96 | 1.2%(+0.698)#4,986 |
| 13. | 38111 | 1.6% | 1.1%(+0.491)#129 | 1.2%(+0.403)#6,440 |
| 14. | 38108 | 1.6% | 1.1%(+0.475)#133 | 1.2%(+0.387)#6,530 |
| 15. | 38125 | 1.4% | 1.1%(+0.306)#146 | 1.2%(+0.218)#7,621 |
| 16. | 38103 | 1.3% | 1.1%(+0.162)#170 | 1.2%(+0.074)#8,670 |
| 17. | 38105 | 1.3% | 1.1%(+0.157)#172 | 1.2%(+0.069)#8,714 |
| 18. | 38117 | 1.2% | 1.1%(+0.052)#191 | 1.2%(-0.036)#9,621 |
| 19. | 38134 | 1.1% | 1.1%(+0.044)#192 | 1.2%(-0.044)#9,709 |
| 20. | 38104 | 1.1% | 1.1%(-0.000)#204 | 1.2%(-0.088)#10,127 |
| 21. | 38118 | 1.1% | 1.1%(-0.042)#214 | 1.2%(-0.130)#10,543 |
| 22. | 38122 | 1.0% | 1.1%(-0.086)#223 | 1.2%(-0.174)#10,970 |
| 23. | 38107 | 0.90% | 1.1%(-0.202)#245 | 1.2%(-0.290)#12,212 |
| 24. | 38120 | 0.80% | 1.1%(-0.301)#258 | 1.2%(-0.389)#13,263 |
| 25. | 38112 | 0.44% | 1.1%(-0.659)#351 | 1.2%(-0.747)#17,230 |
1
Common Questions
What are the Top 10 Zip Codes with the Highest Percentage of Population Employed in Firefighting & Prevention in Memphis, TN?
Top 10 Zip Codes with the Highest Percentage of Population Employed in Firefighting & Prevention in Memphis, TN are:
What zip code has the Highest Percentage of Population Employed in Firefighting & Prevention in Memphis, TN?
38126 has the Highest Percentage of Population Employed in Firefighting & Prevention in Memphis, TN with 6.4%.
What is the Percentage of Population Employed in Firefighting & Prevention in Memphis, TN?
Percentage of Population Employed in Firefighting & Prevention in Memphis is 1.9%.
What is the Percentage of Population Employed in Firefighting & Prevention in Tennessee?
Percentage of Population Employed in Firefighting & Prevention in Tennessee is 1.1%.
What is the Percentage of Population Employed in Firefighting & Prevention in the United States?
Percentage of Population Employed in Firefighting & Prevention in the United States is 1.2%.