Zip Codes with the Highest Percentage of Population Employed in Arts, Entertainment & Recreation in Memphis, TN
RELATED REPORTS & OPTIONS
Arts, Entertainment & Recreation
Memphis
Compare Zip Codes
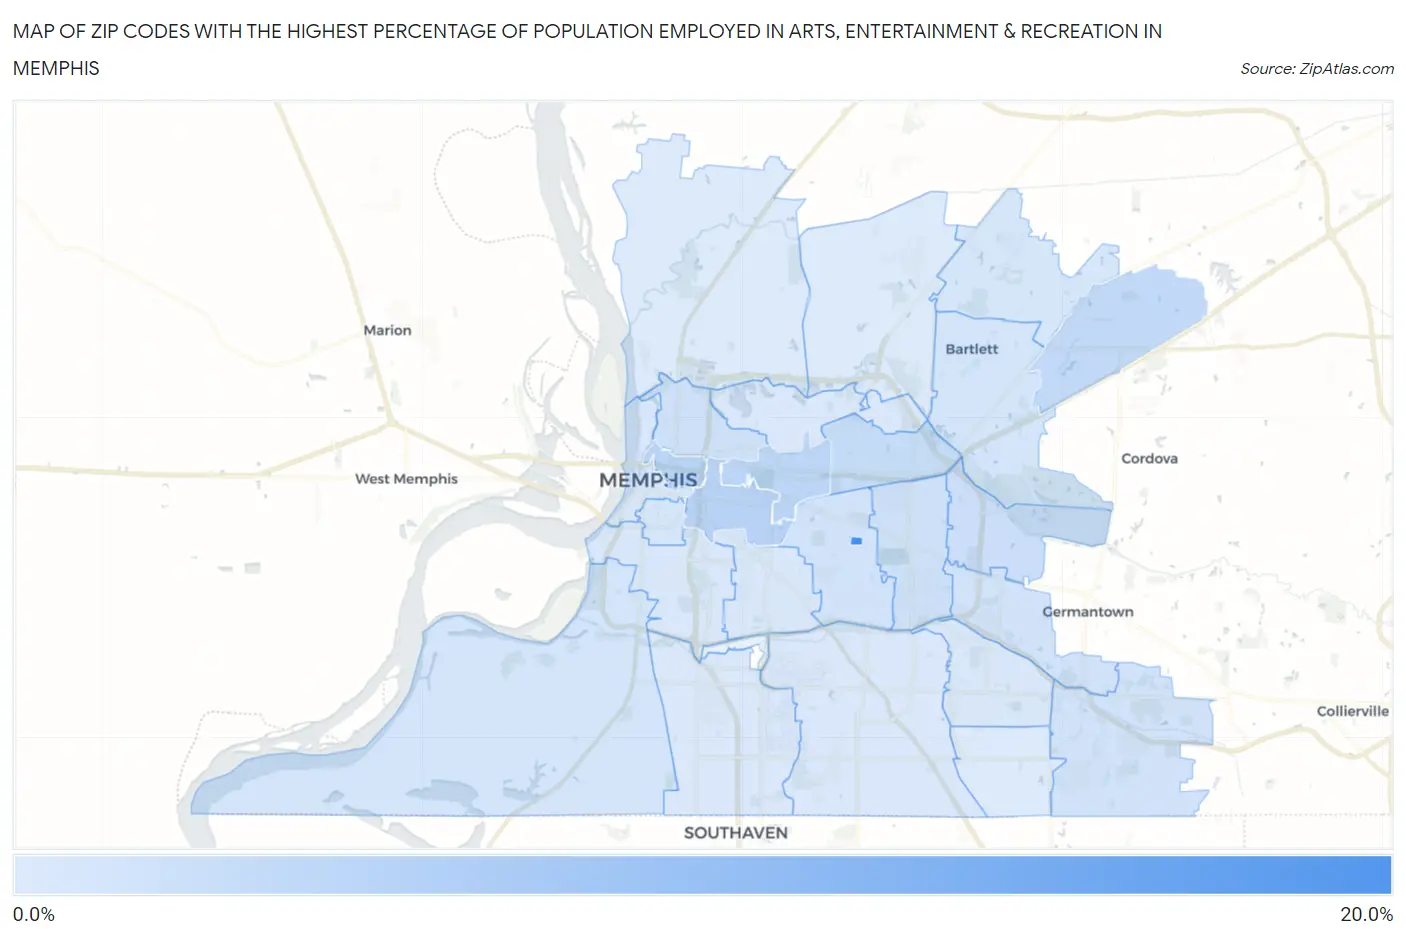
Map of Zip Codes with the Highest Percentage of Population Employed in Arts, Entertainment & Recreation in Memphis
0.41%
15.3%
Zip Codes with the Highest Percentage of Population Employed in Arts, Entertainment & Recreation in Memphis, TN
| Zip Code | % Employed | vs State | vs National | |
| 1. | 38152 | 15.3% | 1.8%(+13.5)#4 | 2.1%(+13.2)#322 |
| 2. | 38104 | 3.9% | 1.8%(+2.14)#50 | 2.1%(+1.84)#3,448 |
| 3. | 38105 | 3.8% | 1.8%(+1.98)#54 | 2.1%(+1.68)#3,688 |
| 4. | 38112 | 3.4% | 1.8%(+1.61)#61 | 2.1%(+1.31)#4,362 |
| 5. | 38133 | 2.9% | 1.8%(+1.16)#82 | 2.1%(+0.862)#5,521 |
| 6. | 38122 | 2.5% | 1.8%(+0.731)#101 | 2.1%(+0.436)#7,096 |
| 7. | 38120 | 2.0% | 1.8%(+0.262)#134 | 2.1%(-0.033)#9,497 |
| 8. | 38107 | 1.6% | 1.8%(-0.143)#170 | 2.1%(-0.438)#12,129 |
| 9. | 38117 | 1.6% | 1.8%(-0.150)#171 | 2.1%(-0.445)#12,178 |
| 10. | 38111 | 1.5% | 1.8%(-0.250)#190 | 2.1%(-0.545)#12,980 |
| 11. | 38125 | 1.4% | 1.8%(-0.375)#204 | 2.1%(-0.670)#13,882 |
| 12. | 38119 | 1.4% | 1.8%(-0.377)#205 | 2.1%(-0.672)#13,904 |
| 13. | 38134 | 1.3% | 1.8%(-0.450)#224 | 2.1%(-0.745)#14,457 |
| 14. | 38109 | 1.2% | 1.8%(-0.558)#239 | 2.1%(-0.853)#15,260 |
| 15. | 38126 | 1.0% | 1.8%(-0.755)#276 | 2.1%(-1.05)#16,709 |
| 16. | 38135 | 1.0% | 1.8%(-0.764)#279 | 2.1%(-1.06)#16,775 |
| 17. | 38103 | 0.94% | 1.8%(-0.849)#293 | 2.1%(-1.14)#17,404 |
| 18. | 38106 | 0.86% | 1.8%(-0.929)#309 | 2.1%(-1.22)#18,007 |
| 19. | 38115 | 0.77% | 1.8%(-1.01)#324 | 2.1%(-1.31)#18,593 |
| 20. | 38114 | 0.76% | 1.8%(-1.03)#328 | 2.1%(-1.32)#18,681 |
| 21. | 38118 | 0.63% | 1.8%(-1.16)#356 | 2.1%(-1.45)#19,627 |
| 22. | 38116 | 0.62% | 1.8%(-1.17)#359 | 2.1%(-1.47)#19,711 |
| 23. | 38108 | 0.55% | 1.8%(-1.24)#370 | 2.1%(-1.54)#20,195 |
| 24. | 38128 | 0.47% | 1.8%(-1.32)#379 | 2.1%(-1.61)#20,671 |
| 25. | 38127 | 0.42% | 1.8%(-1.37)#384 | 2.1%(-1.66)#20,965 |
| 26. | 38141 | 0.41% | 1.8%(-1.38)#387 | 2.1%(-1.67)#21,031 |
1
Common Questions
What are the Top 10 Zip Codes with the Highest Percentage of Population Employed in Arts, Entertainment & Recreation in Memphis, TN?
Top 10 Zip Codes with the Highest Percentage of Population Employed in Arts, Entertainment & Recreation in Memphis, TN are:
What zip code has the Highest Percentage of Population Employed in Arts, Entertainment & Recreation in Memphis, TN?
38152 has the Highest Percentage of Population Employed in Arts, Entertainment & Recreation in Memphis, TN with 15.3%.
What is the Percentage of Population Employed in Arts, Entertainment & Recreation in Memphis, TN?
Percentage of Population Employed in Arts, Entertainment & Recreation in Memphis is 1.4%.
What is the Percentage of Population Employed in Arts, Entertainment & Recreation in Tennessee?
Percentage of Population Employed in Arts, Entertainment & Recreation in Tennessee is 1.8%.
What is the Percentage of Population Employed in Arts, Entertainment & Recreation in the United States?
Percentage of Population Employed in Arts, Entertainment & Recreation in the United States is 2.1%.