Zip Codes with the Highest Percentage of Population Employed in Business & Financial in Sparks, NV
RELATED REPORTS & OPTIONS
Business & Financial
Sparks
Compare Zip Codes
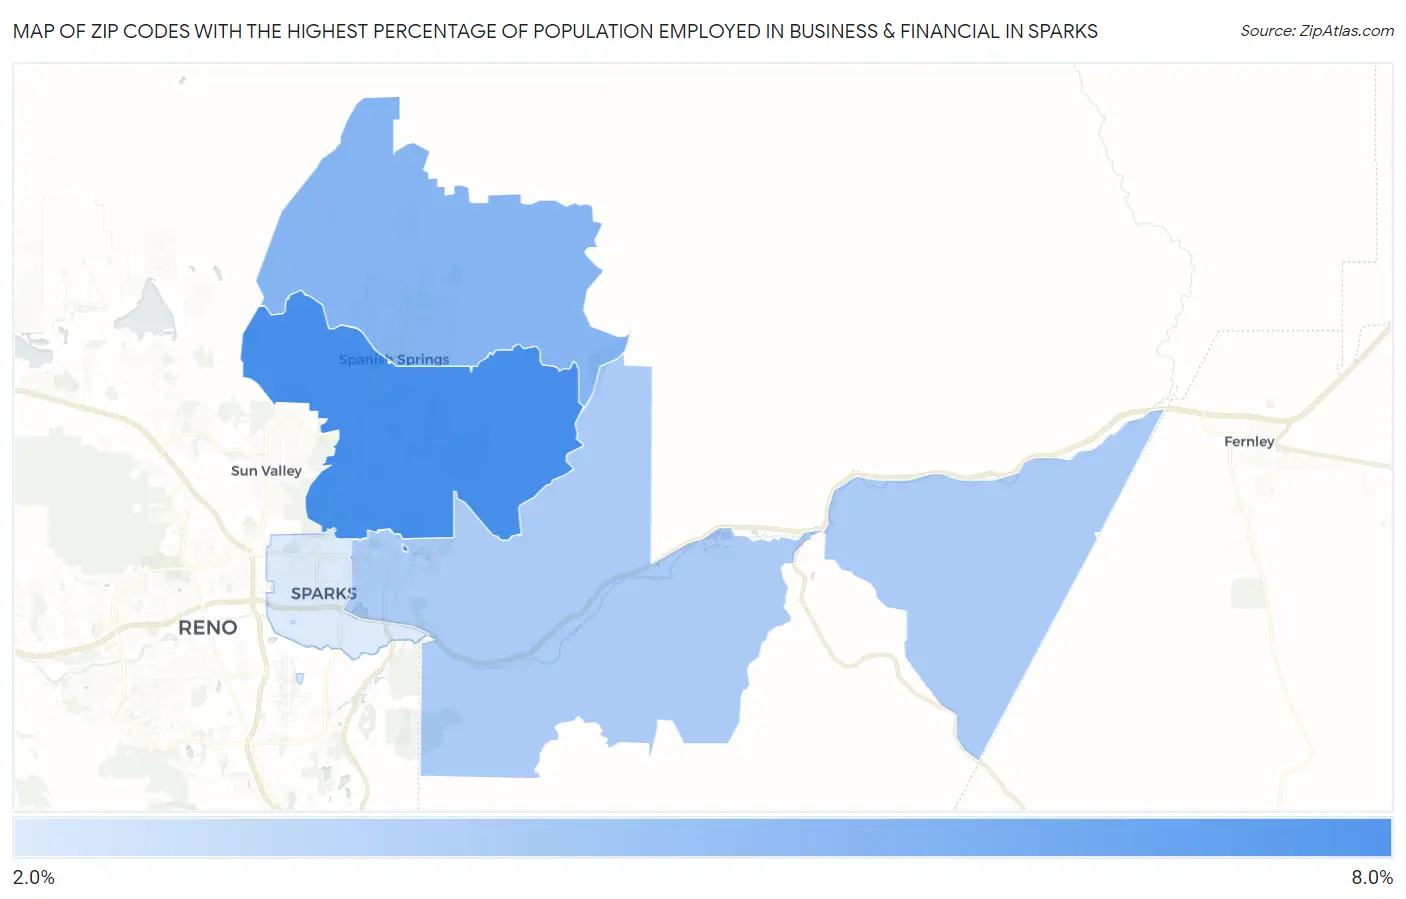
Map of Zip Codes with the Highest Percentage of Population Employed in Business & Financial in Sparks
2.8%
7.1%
Zip Codes with the Highest Percentage of Population Employed in Business & Financial in Sparks, NV
| Zip Code | % Employed | vs State | vs National | |
| 1. | 89436 | 7.1% | 4.6%(+2.59)#28 | 5.8%(+1.38)#5,557 |
| 2. | 89441 | 5.3% | 4.6%(+0.775)#50 | 5.8%(-0.436)#9,503 |
| 3. | 89434 | 4.3% | 4.6%(-0.288)#70 | 5.8%(-1.50)#12,902 |
| 4. | 89431 | 2.8% | 4.6%(-1.73)#99 | 5.8%(-2.94)#18,535 |
1
Common Questions
What are the Top 3 Zip Codes with the Highest Percentage of Population Employed in Business & Financial in Sparks, NV?
Top 3 Zip Codes with the Highest Percentage of Population Employed in Business & Financial in Sparks, NV are:
What zip code has the Highest Percentage of Population Employed in Business & Financial in Sparks, NV?
89436 has the Highest Percentage of Population Employed in Business & Financial in Sparks, NV with 7.1%.
What is the Percentage of Population Employed in Business & Financial in Sparks, NV?
Percentage of Population Employed in Business & Financial in Sparks is 4.9%.
What is the Percentage of Population Employed in Business & Financial in Nevada?
Percentage of Population Employed in Business & Financial in Nevada is 4.6%.
What is the Percentage of Population Employed in Business & Financial in the United States?
Percentage of Population Employed in Business & Financial in the United States is 5.8%.