Zip Codes with the Highest Percentage of Population Employed in Business & Financial in Henderson, NV
RELATED REPORTS & OPTIONS
Business & Financial
Henderson
Compare Zip Codes
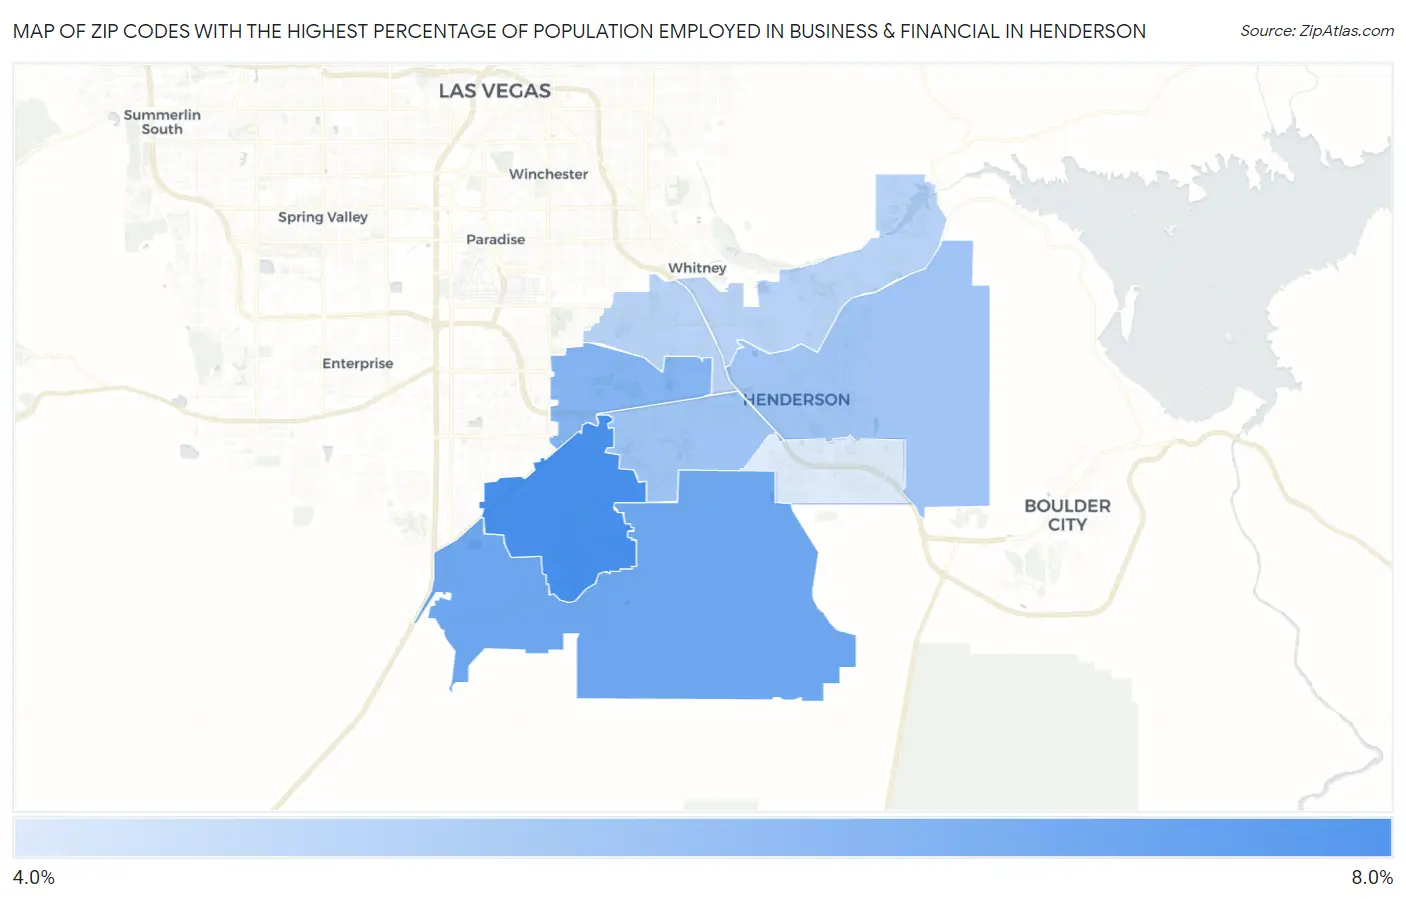
Map of Zip Codes with the Highest Percentage of Population Employed in Business & Financial in Henderson
4.2%
7.7%
Zip Codes with the Highest Percentage of Population Employed in Business & Financial in Henderson, NV
| Zip Code | % Employed | vs State | vs National | |
| 1. | 89052 | 7.7% | 4.6%(+3.12)#20 | 5.8%(+1.91)#4,735 |
| 2. | 89044 | 6.8% | 4.6%(+2.20)#29 | 5.8%(+0.990)#6,260 |
| 3. | 89074 | 6.2% | 4.6%(+1.63)#33 | 5.8%(+0.419)#7,416 |
| 4. | 89012 | 5.6% | 4.6%(+1.05)#43 | 5.8%(-0.159)#8,764 |
| 5. | 89015 | 5.6% | 4.6%(+1.01)#45 | 5.8%(-0.198)#8,874 |
| 6. | 89014 | 5.0% | 4.6%(+0.469)#53 | 5.8%(-0.742)#10,400 |
| 7. | 89011 | 5.0% | 4.6%(+0.453)#54 | 5.8%(-0.758)#10,441 |
| 8. | 89002 | 4.2% | 4.6%(-0.369)#73 | 5.8%(-1.58)#13,192 |
1
Common Questions
What are the Top 5 Zip Codes with the Highest Percentage of Population Employed in Business & Financial in Henderson, NV?
Top 5 Zip Codes with the Highest Percentage of Population Employed in Business & Financial in Henderson, NV are:
What zip code has the Highest Percentage of Population Employed in Business & Financial in Henderson, NV?
89052 has the Highest Percentage of Population Employed in Business & Financial in Henderson, NV with 7.7%.
What is the Percentage of Population Employed in Business & Financial in Henderson, NV?
Percentage of Population Employed in Business & Financial in Henderson is 6.0%.
What is the Percentage of Population Employed in Business & Financial in Nevada?
Percentage of Population Employed in Business & Financial in Nevada is 4.6%.
What is the Percentage of Population Employed in Business & Financial in the United States?
Percentage of Population Employed in Business & Financial in the United States is 5.8%.