Zip Codes with the Highest Percentage of Population with a Degree in Business in New Jersey
RELATED REPORTS & OPTIONS
Business
New Jersey
Compare Zip Codes
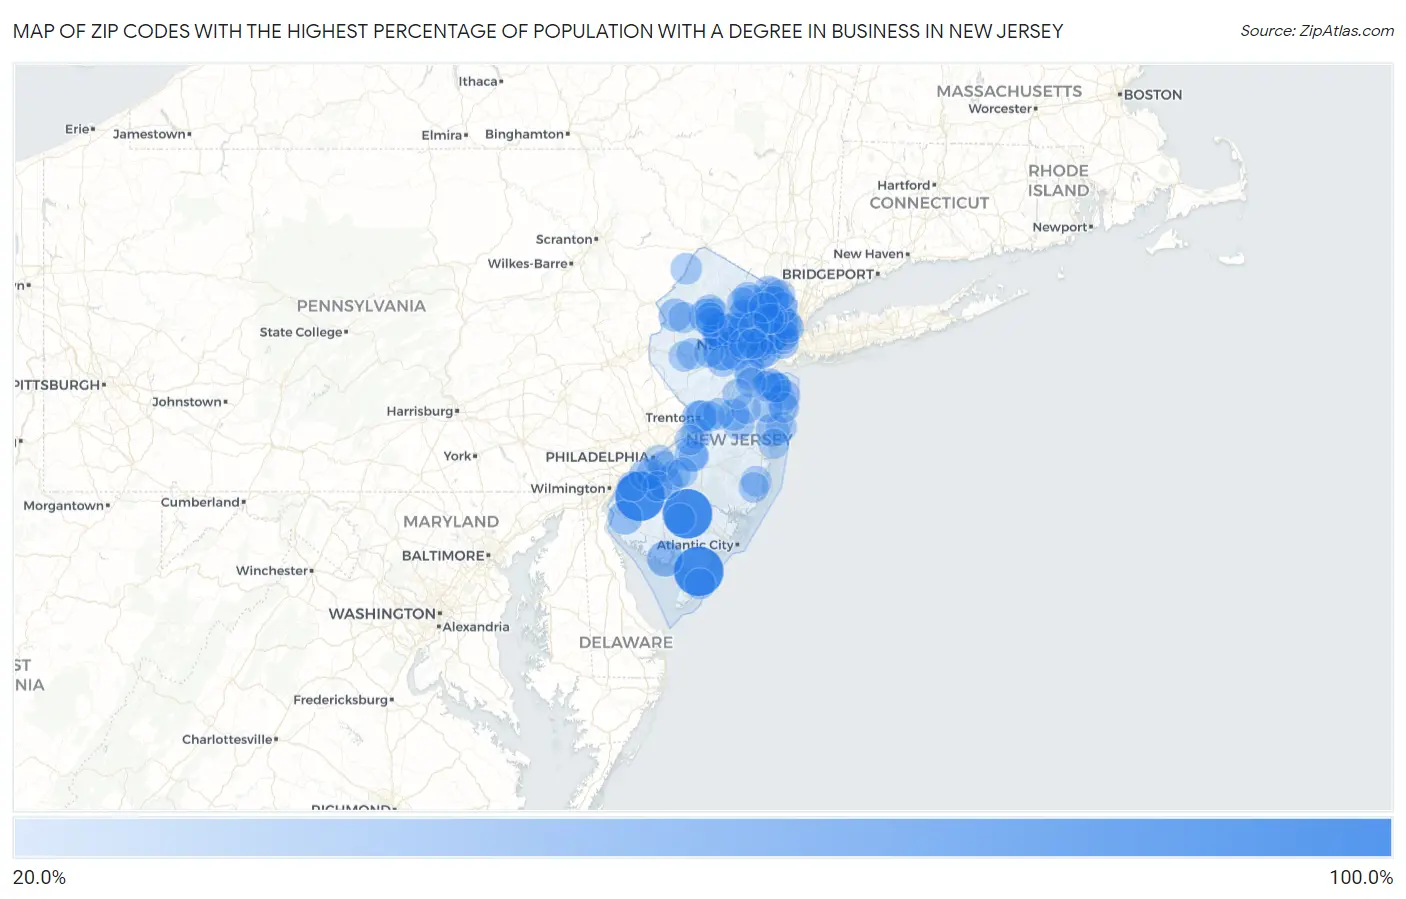
Map of Zip Codes with the Highest Percentage of Population with a Degree in Business in New Jersey
20.0%
100.0%
Zip Codes with the Highest Percentage of Population with a Degree in Business in New Jersey
| Zip Code | % Graduates | vs State | vs National | |
| 1. | 08346 | 100.0% | 20.9%(+79.1)#1 | 19.5%(+80.5)#34 |
| 2. | 08246 | 100.0% | 20.9%(+79.1)#2 | 19.5%(+80.5)#139 |
| 3. | 08039 | 100.0% | 20.9%(+79.1)#3 | 19.5%(+80.5)#181 |
| 4. | 07939 | 56.5% | 20.9%(+35.5)#4 | 19.5%(+37.0)#492 |
| 5. | 07608 | 55.6% | 20.9%(+34.6)#5 | 19.5%(+36.1)#510 |
| 6. | 07970 | 46.8% | 20.9%(+25.8)#6 | 19.5%(+27.3)#810 |
| 7. | 08349 | 46.6% | 20.9%(+25.6)#7 | 19.5%(+27.1)#824 |
| 8. | 07926 | 45.8% | 20.9%(+24.9)#8 | 19.5%(+26.3)#854 |
| 9. | 07857 | 43.0% | 20.9%(+22.0)#9 | 19.5%(+23.5)#997 |
| 10. | 08072 | 40.7% | 20.9%(+19.7)#10 | 19.5%(+21.2)#1,171 |
| 11. | 08032 | 40.0% | 20.9%(+19.1)#11 | 19.5%(+20.5)#1,229 |
| 12. | 07201 | 39.3% | 20.9%(+18.4)#12 | 19.5%(+19.8)#1,280 |
| 13. | 08608 | 38.5% | 20.9%(+17.6)#13 | 19.5%(+19.0)#1,333 |
| 14. | 07004 | 38.0% | 20.9%(+17.1)#14 | 19.5%(+18.5)#1,384 |
| 15. | 08720 | 37.5% | 20.9%(+16.5)#15 | 19.5%(+18.0)#1,443 |
| 16. | 08036 | 35.8% | 20.9%(+14.9)#16 | 19.5%(+16.3)#1,624 |
| 17. | 07311 | 35.4% | 20.9%(+14.5)#17 | 19.5%(+16.0)#1,678 |
| 18. | 07844 | 34.8% | 20.9%(+13.8)#18 | 19.5%(+15.3)#1,763 |
| 19. | 08609 | 32.2% | 20.9%(+11.3)#19 | 19.5%(+12.7)#2,213 |
| 20. | 07457 | 32.1% | 20.9%(+11.2)#20 | 19.5%(+12.6)#2,231 |
| 21. | 08510 | 31.6% | 20.9%(+10.7)#21 | 19.5%(+12.1)#2,364 |
| 22. | 08066 | 31.6% | 20.9%(+10.7)#22 | 19.5%(+12.1)#2,366 |
| 23. | 07502 | 31.4% | 20.9%(+10.5)#23 | 19.5%(+11.9)#2,416 |
| 24. | 08535 | 31.2% | 20.9%(+10.2)#24 | 19.5%(+11.7)#2,485 |
| 25. | 07104 | 30.8% | 20.9%(+9.85)#25 | 19.5%(+11.3)#2,584 |
| 26. | 07205 | 30.8% | 20.9%(+9.84)#26 | 19.5%(+11.3)#2,586 |
| 27. | 08561 | 30.8% | 20.9%(+9.82)#27 | 19.5%(+11.3)#2,600 |
| 28. | 07676 | 30.7% | 20.9%(+9.72)#28 | 19.5%(+11.2)#2,627 |
| 29. | 07945 | 30.2% | 20.9%(+9.26)#29 | 19.5%(+10.7)#2,757 |
| 30. | 07851 | 30.1% | 20.9%(+9.12)#30 | 19.5%(+10.6)#2,806 |
| 31. | 07856 | 29.7% | 20.9%(+8.77)#31 | 19.5%(+10.2)#2,927 |
| 32. | 07458 | 29.7% | 20.9%(+8.73)#32 | 19.5%(+10.2)#2,941 |
| 33. | 08833 | 29.4% | 20.9%(+8.44)#33 | 19.5%(+9.89)#3,060 |
| 34. | 07935 | 29.3% | 20.9%(+8.39)#34 | 19.5%(+9.84)#3,077 |
| 35. | 07082 | 29.3% | 20.9%(+8.35)#35 | 19.5%(+9.80)#3,087 |
| 36. | 07481 | 29.2% | 20.9%(+8.28)#36 | 19.5%(+9.73)#3,114 |
| 37. | 07936 | 29.2% | 20.9%(+8.27)#37 | 19.5%(+9.72)#3,120 |
| 38. | 07045 | 29.0% | 20.9%(+8.04)#38 | 19.5%(+9.49)#3,208 |
| 39. | 08836 | 28.9% | 20.9%(+7.94)#39 | 19.5%(+9.40)#3,247 |
| 40. | 07030 | 28.9% | 20.9%(+7.94)#40 | 19.5%(+9.39)#3,248 |
| 41. | 08202 | 28.8% | 20.9%(+7.89)#41 | 19.5%(+9.34)#3,275 |
| 42. | 07403 | 28.8% | 20.9%(+7.88)#42 | 19.5%(+9.33)#3,279 |
| 43. | 08554 | 28.8% | 20.9%(+7.86)#43 | 19.5%(+9.31)#3,285 |
| 44. | 07838 | 28.8% | 20.9%(+7.84)#44 | 19.5%(+9.29)#3,294 |
| 45. | 07032 | 28.7% | 20.9%(+7.75)#45 | 19.5%(+9.20)#3,329 |
| 46. | 07501 | 28.6% | 20.9%(+7.65)#46 | 19.5%(+9.10)#3,363 |
| 47. | 07758 | 28.6% | 20.9%(+7.65)#47 | 19.5%(+9.10)#3,365 |
| 48. | 08863 | 28.5% | 20.9%(+7.52)#48 | 19.5%(+8.97)#3,445 |
| 49. | 07092 | 28.4% | 20.9%(+7.44)#49 | 19.5%(+8.89)#3,478 |
| 50. | 07843 | 28.2% | 20.9%(+7.25)#50 | 19.5%(+8.70)#3,570 |
| 51. | 07650 | 28.2% | 20.9%(+7.22)#51 | 19.5%(+8.67)#3,586 |
| 52. | 07762 | 28.1% | 20.9%(+7.15)#52 | 19.5%(+8.60)#3,621 |
| 53. | 07503 | 28.1% | 20.9%(+7.14)#53 | 19.5%(+8.59)#3,628 |
| 54. | 07086 | 28.1% | 20.9%(+7.12)#54 | 19.5%(+8.58)#3,643 |
| 55. | 08326 | 28.1% | 20.9%(+7.12)#55 | 19.5%(+8.57)#3,644 |
| 56. | 07111 | 28.1% | 20.9%(+7.12)#56 | 19.5%(+8.57)#3,646 |
| 57. | 07737 | 27.8% | 20.9%(+6.85)#57 | 19.5%(+8.30)#3,782 |
| 58. | 07446 | 27.7% | 20.9%(+6.77)#58 | 19.5%(+8.22)#3,819 |
| 59. | 08758 | 27.7% | 20.9%(+6.71)#59 | 19.5%(+8.16)#3,847 |
| 60. | 07876 | 27.6% | 20.9%(+6.63)#60 | 19.5%(+8.08)#3,888 |
| 61. | 07423 | 27.6% | 20.9%(+6.61)#61 | 19.5%(+8.06)#3,892 |
| 62. | 08106 | 27.5% | 20.9%(+6.57)#62 | 19.5%(+8.02)#3,918 |
| 63. | 07069 | 27.4% | 20.9%(+6.43)#63 | 19.5%(+7.88)#3,998 |
| 64. | 07020 | 27.3% | 20.9%(+6.38)#64 | 19.5%(+7.83)#4,028 |
| 65. | 08832 | 27.0% | 20.9%(+6.03)#65 | 19.5%(+7.48)#4,205 |
| 66. | 08048 | 26.9% | 20.9%(+5.98)#66 | 19.5%(+7.43)#4,231 |
| 67. | 08086 | 26.9% | 20.9%(+5.93)#67 | 19.5%(+7.38)#4,266 |
| 68. | 07734 | 26.9% | 20.9%(+5.91)#68 | 19.5%(+7.36)#4,278 |
| 69. | 07927 | 26.8% | 20.9%(+5.82)#69 | 19.5%(+7.27)#4,341 |
| 70. | 07405 | 26.8% | 20.9%(+5.81)#70 | 19.5%(+7.26)#4,343 |
| 71. | 07649 | 26.7% | 20.9%(+5.78)#71 | 19.5%(+7.23)#4,367 |
| 72. | 07739 | 26.7% | 20.9%(+5.77)#72 | 19.5%(+7.22)#4,371 |
| 73. | 07760 | 26.7% | 20.9%(+5.76)#73 | 19.5%(+7.21)#4,379 |
| 74. | 07722 | 26.6% | 20.9%(+5.66)#74 | 19.5%(+7.11)#4,463 |
| 75. | 07764 | 26.6% | 20.9%(+5.64)#75 | 19.5%(+7.09)#4,477 |
| 76. | 07730 | 26.6% | 20.9%(+5.61)#76 | 19.5%(+7.07)#4,499 |
| 77. | 07202 | 26.5% | 20.9%(+5.50)#77 | 19.5%(+6.95)#4,583 |
| 78. | 07656 | 26.4% | 20.9%(+5.46)#78 | 19.5%(+6.92)#4,609 |
| 79. | 07026 | 26.4% | 20.9%(+5.43)#79 | 19.5%(+6.88)#4,627 |
| 80. | 08005 | 26.4% | 20.9%(+5.41)#80 | 19.5%(+6.86)#4,640 |
| 81. | 08026 | 26.3% | 20.9%(+5.35)#81 | 19.5%(+6.81)#4,681 |
| 82. | 08723 | 26.3% | 20.9%(+5.34)#82 | 19.5%(+6.79)#4,694 |
| 83. | 08801 | 26.3% | 20.9%(+5.31)#83 | 19.5%(+6.76)#4,704 |
| 84. | 07726 | 26.3% | 20.9%(+5.30)#84 | 19.5%(+6.75)#4,709 |
| 85. | 08016 | 26.2% | 20.9%(+5.30)#85 | 19.5%(+6.75)#4,714 |
| 86. | 07718 | 26.1% | 20.9%(+5.15)#86 | 19.5%(+6.60)#4,814 |
| 87. | 07921 | 26.0% | 20.9%(+5.04)#87 | 19.5%(+6.49)#4,885 |
| 88. | 07901 | 25.8% | 20.9%(+4.86)#88 | 19.5%(+6.31)#5,002 |
| 89. | 07011 | 25.8% | 20.9%(+4.84)#89 | 19.5%(+6.29)#5,018 |
| 90. | 07852 | 25.8% | 20.9%(+4.82)#90 | 19.5%(+6.27)#5,041 |
| 91. | 08103 | 25.7% | 20.9%(+4.80)#91 | 19.5%(+6.25)#5,057 |
| 92. | 07508 | 25.7% | 20.9%(+4.76)#92 | 19.5%(+6.21)#5,091 |
| 93. | 08080 | 25.7% | 20.9%(+4.75)#93 | 19.5%(+6.20)#5,095 |
| 94. | 08053 | 25.7% | 20.9%(+4.75)#94 | 19.5%(+6.20)#5,101 |
| 95. | 07021 | 25.7% | 20.9%(+4.75)#95 | 19.5%(+6.20)#5,103 |
| 96. | 08085 | 25.7% | 20.9%(+4.74)#96 | 19.5%(+6.19)#5,107 |
| 97. | 08859 | 25.7% | 20.9%(+4.74)#97 | 19.5%(+6.19)#5,112 |
| 98. | 08828 | 25.7% | 20.9%(+4.72)#98 | 19.5%(+6.17)#5,120 |
| 99. | 08690 | 25.5% | 20.9%(+4.60)#99 | 19.5%(+6.05)#5,216 |
| 100. | 07088 | 25.5% | 20.9%(+4.58)#100 | 19.5%(+6.03)#5,233 |
Common Questions
What are the Top 10 Zip Codes with the Highest Percentage of Population with a Degree in Business in New Jersey?
Top 10 Zip Codes with the Highest Percentage of Population with a Degree in Business in New Jersey are:
What zip code has the Highest Percentage of Population with a Degree in Business in New Jersey?
08346 has the Highest Percentage of Population with a Degree in Business in New Jersey with 100.0%.
What is the Percentage of Population with a Degree in Business in the State of New Jersey?
Percentage of Population with a Degree in Business in New Jersey is 20.9%.
What is the Percentage of Population with a Degree in Business in the United States?
Percentage of Population with a Degree in Business in the United States is 19.5%.