Zip Codes with the Highest Percentage of Households Heated by Fuel Oil / Kerosene in New Jersey
RELATED REPORTS & OPTIONS
Fuel Oil Heating
New Jersey
Compare Zip Codes
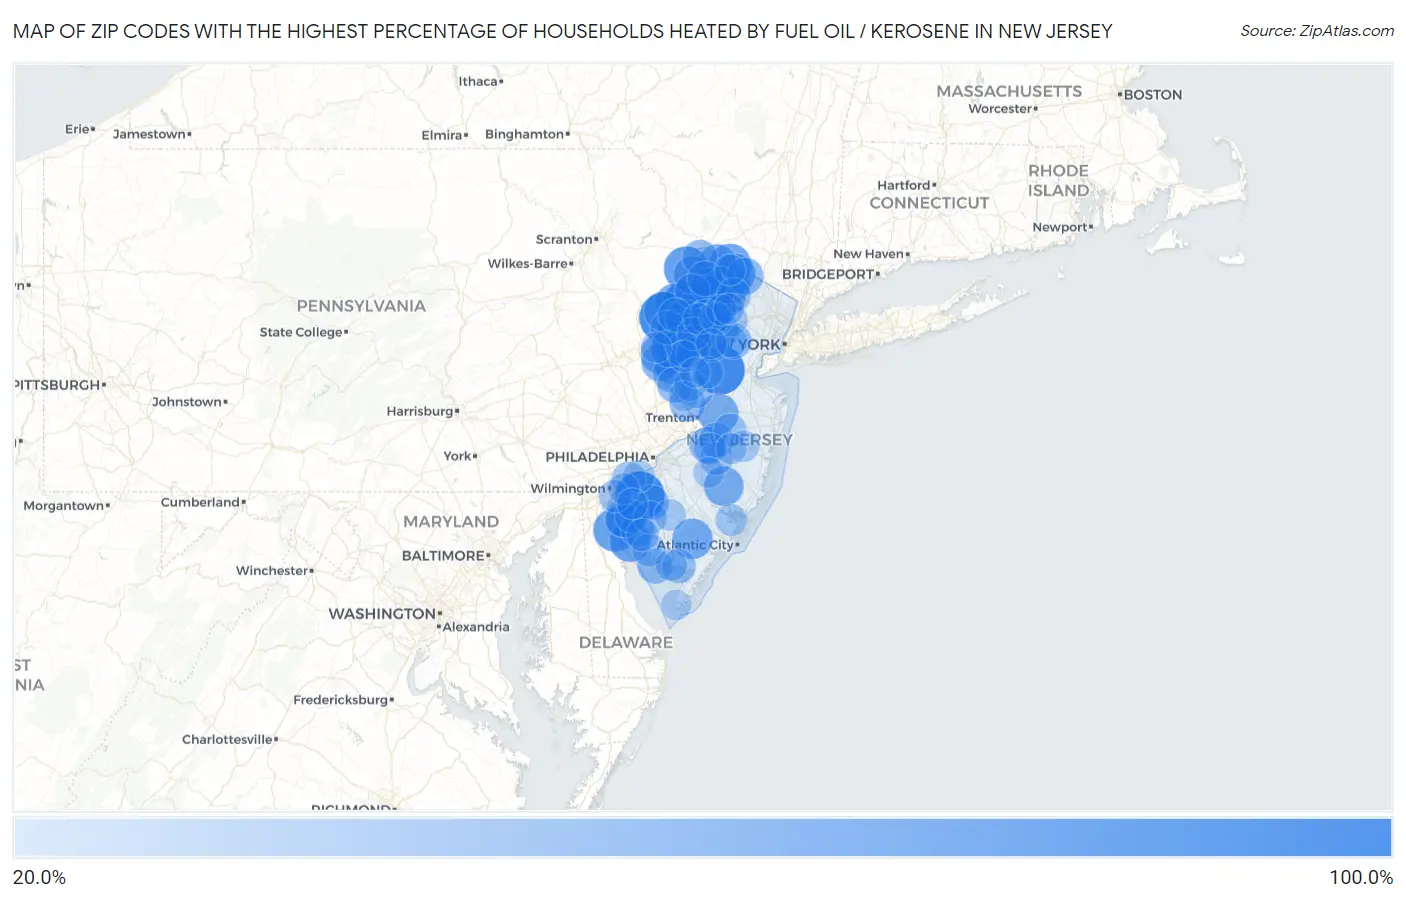
Map of Zip Codes with the Highest Percentage of Households Heated by Fuel Oil / Kerosene in New Jersey
20.0%
100.0%
Zip Codes with the Highest Percentage of Households Heated by Fuel Oil / Kerosene in New Jersey
| Zip Code | Fuel Oil Heating | vs State | vs National | |
| 1. | 07833 | 100.0% | 7.2%(+92.8)#1 | 4.2%(+95.8)#32 |
| 2. | 08890 | 100.0% | 7.2%(+92.8)#2 | 4.2%(+95.8)#47 |
| 3. | 07831 | 100.0% | 7.2%(+92.8)#3 | 4.2%(+95.8)#68 |
| 4. | 07870 | 100.0% | 7.2%(+92.8)#4 | 4.2%(+95.8)#69 |
| 5. | 07846 | 100.0% | 7.2%(+92.8)#5 | 4.2%(+95.8)#82 |
| 6. | 08039 | 100.0% | 7.2%(+92.8)#6 | 4.2%(+95.8)#88 |
| 7. | 07851 | 80.6% | 7.2%(+73.4)#7 | 4.2%(+76.4)#253 |
| 8. | 08038 | 75.8% | 7.2%(+68.6)#8 | 4.2%(+71.6)#343 |
| 9. | 07418 | 72.6% | 7.2%(+65.4)#9 | 4.2%(+68.4)#430 |
| 10. | 07874 | 72.3% | 7.2%(+65.1)#10 | 4.2%(+68.1)#440 |
| 11. | 08323 | 67.2% | 7.2%(+60.0)#11 | 4.2%(+63.0)#665 |
| 12. | 07439 | 66.3% | 7.2%(+59.1)#12 | 4.2%(+62.1)#721 |
| 13. | 07825 | 64.5% | 7.2%(+57.3)#13 | 4.2%(+60.3)#817 |
| 14. | 07460 | 64.0% | 7.2%(+56.8)#14 | 4.2%(+59.8)#848 |
| 15. | 08317 | 63.6% | 7.2%(+56.4)#15 | 4.2%(+59.4)#878 |
| 16. | 07422 | 63.5% | 7.2%(+56.3)#16 | 4.2%(+59.3)#884 |
| 17. | 07843 | 61.8% | 7.2%(+54.6)#17 | 4.2%(+57.6)#986 |
| 18. | 08561 | 60.9% | 7.2%(+53.7)#18 | 4.2%(+56.7)#1,050 |
| 19. | 08019 | 60.8% | 7.2%(+53.6)#19 | 4.2%(+56.6)#1,056 |
| 20. | 08072 | 60.6% | 7.2%(+53.4)#20 | 4.2%(+56.4)#1,068 |
| 21. | 07832 | 60.4% | 7.2%(+53.2)#21 | 4.2%(+56.2)#1,076 |
| 22. | 08804 | 60.3% | 7.2%(+53.1)#22 | 4.2%(+56.1)#1,082 |
| 23. | 07849 | 58.7% | 7.2%(+51.5)#23 | 4.2%(+54.5)#1,198 |
| 24. | 07821 | 58.5% | 7.2%(+51.3)#24 | 4.2%(+54.3)#1,209 |
| 25. | 07863 | 57.8% | 7.2%(+50.6)#25 | 4.2%(+53.6)#1,263 |
| 26. | 07461 | 57.1% | 7.2%(+49.9)#26 | 4.2%(+52.9)#1,306 |
| 27. | 07850 | 56.6% | 7.2%(+49.4)#27 | 4.2%(+52.4)#1,349 |
| 28. | 07880 | 56.4% | 7.2%(+49.2)#28 | 4.2%(+52.2)#1,371 |
| 29. | 08827 | 55.3% | 7.2%(+48.1)#29 | 4.2%(+51.1)#1,449 |
| 30. | 07865 | 55.0% | 7.2%(+47.8)#30 | 4.2%(+50.8)#1,479 |
| 31. | 07438 | 54.9% | 7.2%(+47.7)#31 | 4.2%(+50.7)#1,489 |
| 32. | 08867 | 54.7% | 7.2%(+47.5)#32 | 4.2%(+50.5)#1,507 |
| 33. | 07826 | 54.7% | 7.2%(+47.5)#33 | 4.2%(+50.5)#1,508 |
| 34. | 07416 | 54.3% | 7.2%(+47.1)#34 | 4.2%(+50.1)#1,537 |
| 35. | 07871 | 52.3% | 7.2%(+45.1)#35 | 4.2%(+48.1)#1,677 |
| 36. | 08848 | 51.2% | 7.2%(+44.0)#36 | 4.2%(+47.0)#1,756 |
| 37. | 08825 | 50.5% | 7.2%(+43.3)#37 | 4.2%(+46.3)#1,802 |
| 38. | 07421 | 50.4% | 7.2%(+43.2)#38 | 4.2%(+46.2)#1,811 |
| 39. | 08802 | 50.2% | 7.2%(+43.0)#39 | 4.2%(+46.0)#1,818 |
| 40. | 07838 | 50.2% | 7.2%(+43.0)#40 | 4.2%(+46.0)#1,819 |
| 41. | 08826 | 48.0% | 7.2%(+40.8)#41 | 4.2%(+43.8)#1,969 |
| 42. | 07970 | 47.9% | 7.2%(+40.7)#42 | 4.2%(+43.7)#1,984 |
| 43. | 08041 | 47.4% | 7.2%(+40.2)#43 | 4.2%(+43.2)#2,020 |
| 44. | 07977 | 47.4% | 7.2%(+40.2)#44 | 4.2%(+43.2)#2,021 |
| 45. | 07848 | 46.6% | 7.2%(+39.4)#45 | 4.2%(+42.4)#2,072 |
| 46. | 08560 | 45.5% | 7.2%(+38.3)#46 | 4.2%(+41.3)#2,142 |
| 47. | 08559 | 44.8% | 7.2%(+37.6)#47 | 4.2%(+40.6)#2,193 |
| 48. | 07935 | 44.6% | 7.2%(+37.4)#48 | 4.2%(+40.4)#2,216 |
| 49. | 07830 | 43.9% | 7.2%(+36.7)#49 | 4.2%(+39.7)#2,260 |
| 50. | 08343 | 43.4% | 7.2%(+36.2)#50 | 4.2%(+39.2)#2,301 |
| 51. | 07860 | 43.3% | 7.2%(+36.1)#51 | 4.2%(+39.1)#2,307 |
| 52. | 07827 | 43.3% | 7.2%(+36.1)#52 | 4.2%(+39.1)#2,309 |
| 53. | 07822 | 43.2% | 7.2%(+36.0)#53 | 4.2%(+39.0)#2,322 |
| 54. | 08321 | 42.1% | 7.2%(+34.9)#54 | 4.2%(+37.9)#2,405 |
| 55. | 08562 | 41.5% | 7.2%(+34.3)#55 | 4.2%(+37.3)#2,443 |
| 56. | 08829 | 40.9% | 7.2%(+33.7)#56 | 4.2%(+36.7)#2,496 |
| 57. | 08079 | 40.3% | 7.2%(+33.1)#57 | 4.2%(+36.1)#2,545 |
| 58. | 08314 | 39.2% | 7.2%(+32.0)#58 | 4.2%(+35.0)#2,633 |
| 59. | 07823 | 38.6% | 7.2%(+31.4)#59 | 4.2%(+34.4)#2,667 |
| 60. | 07435 | 38.6% | 7.2%(+31.4)#60 | 4.2%(+34.4)#2,671 |
| 61. | 08014 | 38.5% | 7.2%(+31.3)#61 | 4.2%(+34.3)#2,679 |
| 62. | 07857 | 38.1% | 7.2%(+30.9)#62 | 4.2%(+33.9)#2,699 |
| 63. | 08525 | 37.6% | 7.2%(+30.4)#63 | 4.2%(+33.4)#2,747 |
| 64. | 07844 | 37.0% | 7.2%(+29.8)#64 | 4.2%(+32.8)#2,793 |
| 65. | 08353 | 35.7% | 7.2%(+28.5)#65 | 4.2%(+31.5)#2,883 |
| 66. | 08833 | 35.3% | 7.2%(+28.1)#66 | 4.2%(+31.1)#2,921 |
| 67. | 08311 | 34.8% | 7.2%(+27.6)#67 | 4.2%(+30.6)#2,970 |
| 68. | 08001 | 34.7% | 7.2%(+27.5)#68 | 4.2%(+30.5)#2,980 |
| 69. | 07853 | 34.6% | 7.2%(+27.4)#69 | 4.2%(+30.4)#2,989 |
| 70. | 08318 | 34.6% | 7.2%(+27.4)#70 | 4.2%(+30.4)#2,990 |
| 71. | 08514 | 34.2% | 7.2%(+27.0)#71 | 4.2%(+30.0)#3,022 |
| 72. | 08064 | 34.1% | 7.2%(+26.9)#72 | 4.2%(+29.9)#3,035 |
| 73. | 07878 | 33.8% | 7.2%(+26.6)#73 | 4.2%(+29.6)#3,052 |
| 74. | 08302 | 32.8% | 7.2%(+25.6)#74 | 4.2%(+28.6)#3,110 |
| 75. | 08023 | 32.7% | 7.2%(+25.5)#75 | 4.2%(+28.5)#3,123 |
| 76. | 08551 | 31.7% | 7.2%(+24.5)#76 | 4.2%(+27.5)#3,202 |
| 77. | 08042 | 31.6% | 7.2%(+24.4)#77 | 4.2%(+27.4)#3,213 |
| 78. | 07976 | 31.0% | 7.2%(+23.8)#78 | 4.2%(+26.8)#3,260 |
| 79. | 08027 | 30.9% | 7.2%(+23.7)#79 | 4.2%(+26.7)#3,265 |
| 80. | 07803 | 30.9% | 7.2%(+23.7)#80 | 4.2%(+26.7)#3,266 |
| 81. | 07847 | 30.1% | 7.2%(+22.9)#81 | 4.2%(+25.9)#3,325 |
| 82. | 08324 | 29.7% | 7.2%(+22.5)#82 | 4.2%(+25.5)#3,363 |
| 83. | 08241 | 29.5% | 7.2%(+22.3)#83 | 4.2%(+25.3)#3,369 |
| 84. | 08344 | 29.4% | 7.2%(+22.2)#84 | 4.2%(+25.2)#3,372 |
| 85. | 08067 | 29.0% | 7.2%(+21.8)#85 | 4.2%(+24.8)#3,413 |
| 86. | 08821 | 28.9% | 7.2%(+21.7)#86 | 4.2%(+24.7)#3,421 |
| 87. | 08801 | 28.5% | 7.2%(+21.3)#87 | 4.2%(+24.3)#3,453 |
| 88. | 07828 | 28.3% | 7.2%(+21.1)#88 | 4.2%(+24.1)#3,461 |
| 89. | 08733 | 28.3% | 7.2%(+21.1)#89 | 4.2%(+24.1)#3,464 |
| 90. | 07462 | 27.7% | 7.2%(+20.5)#90 | 4.2%(+23.5)#3,536 |
| 91. | 07931 | 27.5% | 7.2%(+20.3)#91 | 4.2%(+23.3)#3,552 |
| 92. | 08098 | 27.3% | 7.2%(+20.1)#92 | 4.2%(+23.1)#3,565 |
| 93. | 08865 | 26.8% | 7.2%(+19.6)#93 | 4.2%(+22.6)#3,603 |
| 94. | 07885 | 26.2% | 7.2%(+19.0)#94 | 4.2%(+22.0)#3,654 |
| 95. | 08088 | 26.1% | 7.2%(+18.9)#95 | 4.2%(+21.9)#3,663 |
| 96. | 07866 | 26.0% | 7.2%(+18.8)#96 | 4.2%(+21.8)#3,672 |
| 97. | 08533 | 25.7% | 7.2%(+18.5)#97 | 4.2%(+21.5)#3,697 |
| 98. | 08212 | 24.7% | 7.2%(+17.5)#98 | 4.2%(+20.5)#3,807 |
| 99. | 08530 | 24.5% | 7.2%(+17.3)#99 | 4.2%(+20.3)#3,816 |
| 100. | 08887 | 24.1% | 7.2%(+16.9)#100 | 4.2%(+19.9)#3,854 |
Common Questions
What are the Top 10 Zip Codes with the Highest Percentage of Households Heated by Fuel Oil / Kerosene in New Jersey?
Top 10 Zip Codes with the Highest Percentage of Households Heated by Fuel Oil / Kerosene in New Jersey are:
What zip code has the Highest Percentage of Households Heated by Fuel Oil / Kerosene in New Jersey?
07833 has the Highest Percentage of Households Heated by Fuel Oil / Kerosene in New Jersey with 100.0%.
What is the Percentage of Households Heated by Fuel Oil / Kerosene in the State of New Jersey?
Percentage of Households Heated by Fuel Oil / Kerosene in New Jersey is 7.2%.
What is the Percentage of Households Heated by Fuel Oil / Kerosene in the United States?
Percentage of Households Heated by Fuel Oil / Kerosene in the United States is 4.2%.