Zip Codes with the Highest Percentage of Population with a Degree in Social Sciences in New Jersey
RELATED REPORTS & OPTIONS
Social Sciences
New Jersey
Compare Zip Codes
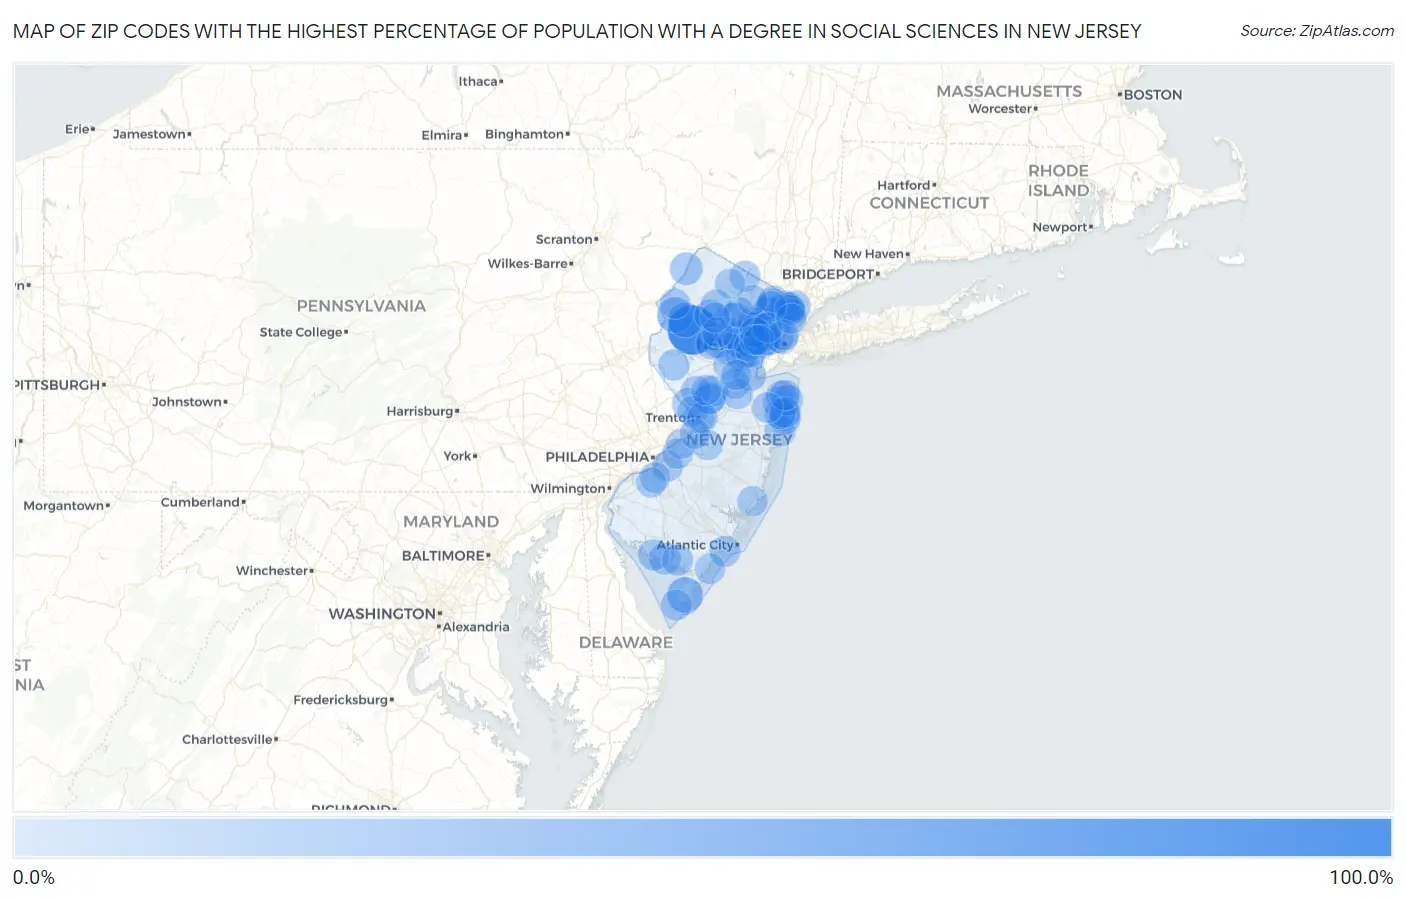
Map of Zip Codes with the Highest Percentage of Population with a Degree in Social Sciences in New Jersey
0.0%
100.0%
Zip Codes with the Highest Percentage of Population with a Degree in Social Sciences in New Jersey
| Zip Code | % Graduates | vs State | vs National | |
| 1. | 07870 | 100.0% | 8.6%(+91.4)#1 | 8.1%(+91.9)#48 |
| 2. | 08242 | 35.7% | 8.6%(+27.2)#2 | 8.1%(+27.7)#301 |
| 3. | 07844 | 34.8% | 8.6%(+26.2)#3 | 8.1%(+26.7)#316 |
| 4. | 07880 | 31.8% | 8.6%(+23.3)#4 | 8.1%(+23.7)#387 |
| 5. | 07878 | 24.5% | 8.6%(+15.9)#5 | 8.1%(+16.4)#669 |
| 6. | 07851 | 21.6% | 8.6%(+13.0)#6 | 8.1%(+13.5)#841 |
| 7. | 07504 | 20.1% | 8.6%(+11.5)#7 | 8.1%(+12.0)#956 |
| 8. | 07043 | 19.1% | 8.6%(+10.5)#8 | 8.1%(+11.0)#1,069 |
| 9. | 08832 | 18.7% | 8.6%(+10.1)#9 | 8.1%(+10.6)#1,129 |
| 10. | 07702 | 17.8% | 8.6%(+9.27)#10 | 8.1%(+9.76)#1,273 |
| 11. | 07078 | 17.8% | 8.6%(+9.22)#11 | 8.1%(+9.72)#1,275 |
| 12. | 07980 | 17.7% | 8.6%(+9.17)#12 | 8.1%(+9.67)#1,282 |
| 13. | 08349 | 17.0% | 8.6%(+8.48)#13 | 8.1%(+8.97)#1,388 |
| 14. | 08542 | 16.5% | 8.6%(+7.92)#14 | 8.1%(+8.41)#1,515 |
| 15. | 07028 | 16.5% | 8.6%(+7.89)#15 | 8.1%(+8.38)#1,524 |
| 16. | 07628 | 16.2% | 8.6%(+7.66)#16 | 8.1%(+8.15)#1,578 |
| 17. | 07023 | 16.0% | 8.6%(+7.44)#17 | 8.1%(+7.93)#1,632 |
| 18. | 07711 | 16.0% | 8.6%(+7.43)#18 | 8.1%(+7.92)#1,640 |
| 19. | 07620 | 15.6% | 8.6%(+7.08)#19 | 8.1%(+7.57)#1,748 |
| 20. | 08608 | 15.6% | 8.6%(+6.99)#20 | 8.1%(+7.48)#1,774 |
| 21. | 07079 | 15.5% | 8.6%(+6.94)#21 | 8.1%(+7.43)#1,800 |
| 22. | 07041 | 15.4% | 8.6%(+6.85)#22 | 8.1%(+7.34)#1,823 |
| 23. | 07850 | 15.3% | 8.6%(+6.72)#23 | 8.1%(+7.22)#1,860 |
| 24. | 07704 | 15.2% | 8.6%(+6.66)#24 | 8.1%(+7.15)#1,874 |
| 25. | 07756 | 15.2% | 8.6%(+6.63)#25 | 8.1%(+7.12)#1,884 |
| 26. | 07924 | 15.0% | 8.6%(+6.48)#26 | 8.1%(+6.98)#1,930 |
| 27. | 08345 | 15.0% | 8.6%(+6.44)#27 | 8.1%(+6.93)#1,951 |
| 28. | 07514 | 14.9% | 8.6%(+6.34)#28 | 8.1%(+6.84)#1,990 |
| 29. | 07931 | 14.9% | 8.6%(+6.30)#29 | 8.1%(+6.79)#2,007 |
| 30. | 07901 | 14.6% | 8.6%(+6.04)#30 | 8.1%(+6.53)#2,104 |
| 31. | 08327 | 14.5% | 8.6%(+5.97)#31 | 8.1%(+6.46)#2,129 |
| 32. | 07090 | 14.5% | 8.6%(+5.89)#32 | 8.1%(+6.39)#2,156 |
| 33. | 08867 | 14.4% | 8.6%(+5.88)#33 | 8.1%(+6.38)#2,160 |
| 34. | 08750 | 14.4% | 8.6%(+5.87)#34 | 8.1%(+6.36)#2,162 |
| 35. | 08553 | 14.3% | 8.6%(+5.72)#35 | 8.1%(+6.21)#2,212 |
| 36. | 07750 | 14.1% | 8.6%(+5.55)#36 | 8.1%(+6.04)#2,303 |
| 37. | 07042 | 14.0% | 8.6%(+5.44)#37 | 8.1%(+5.94)#2,349 |
| 38. | 07423 | 13.9% | 8.6%(+5.35)#38 | 8.1%(+5.84)#2,383 |
| 39. | 08544 | 13.9% | 8.6%(+5.31)#39 | 8.1%(+5.81)#2,396 |
| 40. | 08403 | 13.8% | 8.6%(+5.27)#40 | 8.1%(+5.76)#2,414 |
| 41. | 08212 | 13.8% | 8.6%(+5.26)#41 | 8.1%(+5.75)#2,417 |
| 42. | 07641 | 13.8% | 8.6%(+5.19)#42 | 8.1%(+5.68)#2,453 |
| 43. | 08560 | 13.7% | 8.6%(+5.16)#43 | 8.1%(+5.65)#2,469 |
| 44. | 07712 | 13.7% | 8.6%(+5.12)#44 | 8.1%(+5.61)#2,490 |
| 45. | 07849 | 13.6% | 8.6%(+5.06)#45 | 8.1%(+5.55)#2,532 |
| 46. | 07050 | 13.5% | 8.6%(+4.95)#46 | 8.1%(+5.45)#2,585 |
| 47. | 08525 | 13.5% | 8.6%(+4.89)#47 | 8.1%(+5.38)#2,612 |
| 48. | 07960 | 13.4% | 8.6%(+4.81)#48 | 8.1%(+5.30)#2,646 |
| 49. | 07421 | 13.3% | 8.6%(+4.72)#49 | 8.1%(+5.21)#2,685 |
| 50. | 07450 | 13.2% | 8.6%(+4.68)#50 | 8.1%(+5.18)#2,704 |
| 51. | 07940 | 13.2% | 8.6%(+4.64)#51 | 8.1%(+5.13)#2,732 |
| 52. | 08828 | 13.2% | 8.6%(+4.61)#52 | 8.1%(+5.10)#2,744 |
| 53. | 07723 | 12.9% | 8.6%(+4.32)#53 | 8.1%(+4.81)#2,893 |
| 54. | 07046 | 12.9% | 8.6%(+4.32)#54 | 8.1%(+4.81)#2,895 |
| 55. | 08033 | 12.9% | 8.6%(+4.30)#55 | 8.1%(+4.79)#2,905 |
| 56. | 07760 | 12.8% | 8.6%(+4.21)#56 | 8.1%(+4.70)#2,959 |
| 57. | 07722 | 12.8% | 8.6%(+4.20)#57 | 8.1%(+4.69)#2,969 |
| 58. | 07928 | 12.7% | 8.6%(+4.15)#58 | 8.1%(+4.64)#2,996 |
| 59. | 07108 | 12.7% | 8.6%(+4.10)#59 | 8.1%(+4.59)#3,026 |
| 60. | 07021 | 12.6% | 8.6%(+4.08)#60 | 8.1%(+4.57)#3,034 |
| 61. | 07103 | 12.6% | 8.6%(+4.06)#61 | 8.1%(+4.56)#3,042 |
| 62. | 07670 | 12.4% | 8.6%(+3.83)#62 | 8.1%(+4.33)#3,219 |
| 63. | 07068 | 12.3% | 8.6%(+3.73)#63 | 8.1%(+4.22)#3,285 |
| 64. | 07104 | 12.2% | 8.6%(+3.62)#64 | 8.1%(+4.12)#3,360 |
| 65. | 08628 | 12.2% | 8.6%(+3.61)#65 | 8.1%(+4.11)#3,369 |
| 66. | 07627 | 12.1% | 8.6%(+3.54)#66 | 8.1%(+4.03)#3,419 |
| 67. | 07626 | 12.1% | 8.6%(+3.50)#67 | 8.1%(+4.00)#3,455 |
| 68. | 07452 | 12.0% | 8.6%(+3.44)#68 | 8.1%(+3.94)#3,496 |
| 69. | 07006 | 12.0% | 8.6%(+3.44)#69 | 8.1%(+3.94)#3,497 |
| 70. | 08850 | 12.0% | 8.6%(+3.43)#70 | 8.1%(+3.93)#3,506 |
| 71. | 07945 | 11.9% | 8.6%(+3.36)#71 | 8.1%(+3.85)#3,555 |
| 72. | 08057 | 11.9% | 8.6%(+3.32)#72 | 8.1%(+3.82)#3,584 |
| 73. | 08629 | 11.8% | 8.6%(+3.23)#73 | 8.1%(+3.72)#3,667 |
| 74. | 07081 | 11.7% | 8.6%(+3.16)#74 | 8.1%(+3.65)#3,719 |
| 75. | 07005 | 11.7% | 8.6%(+3.14)#75 | 8.1%(+3.63)#3,740 |
| 76. | 08846 | 11.7% | 8.6%(+3.09)#76 | 8.1%(+3.59)#3,771 |
| 77. | 07030 | 11.6% | 8.6%(+3.02)#77 | 8.1%(+3.51)#3,846 |
| 78. | 08092 | 11.6% | 8.6%(+3.00)#78 | 8.1%(+3.49)#3,866 |
| 79. | 07044 | 11.6% | 8.6%(+2.99)#79 | 8.1%(+3.48)#3,872 |
| 80. | 07102 | 11.6% | 8.6%(+2.99)#80 | 8.1%(+3.48)#3,878 |
| 81. | 07016 | 11.5% | 8.6%(+2.94)#81 | 8.1%(+3.44)#3,913 |
| 82. | 07825 | 11.5% | 8.6%(+2.93)#82 | 8.1%(+3.42)#3,921 |
| 83. | 08558 | 11.4% | 8.6%(+2.88)#83 | 8.1%(+3.37)#3,959 |
| 84. | 08248 | 11.4% | 8.6%(+2.86)#84 | 8.1%(+3.36)#3,977 |
| 85. | 07307 | 11.4% | 8.6%(+2.83)#85 | 8.1%(+3.32)#4,005 |
| 86. | 07052 | 11.4% | 8.6%(+2.83)#86 | 8.1%(+3.32)#4,006 |
| 87. | 07086 | 11.4% | 8.6%(+2.79)#87 | 8.1%(+3.29)#4,034 |
| 88. | 07847 | 11.3% | 8.6%(+2.73)#88 | 8.1%(+3.23)#4,080 |
| 89. | 07040 | 11.3% | 8.6%(+2.73)#89 | 8.1%(+3.22)#4,086 |
| 90. | 08041 | 11.2% | 8.6%(+2.66)#90 | 8.1%(+3.16)#4,146 |
| 91. | 07110 | 11.2% | 8.6%(+2.62)#91 | 8.1%(+3.12)#4,182 |
| 92. | 08097 | 11.2% | 8.6%(+2.59)#92 | 8.1%(+3.08)#4,220 |
| 93. | 07632 | 11.1% | 8.6%(+2.57)#93 | 8.1%(+3.06)#4,241 |
| 94. | 08904 | 11.1% | 8.6%(+2.57)#94 | 8.1%(+3.06)#4,244 |
| 95. | 08010 | 11.1% | 8.6%(+2.49)#95 | 8.1%(+2.99)#4,325 |
| 96. | 08518 | 11.0% | 8.6%(+2.46)#96 | 8.1%(+2.96)#4,356 |
| 97. | 07442 | 11.0% | 8.6%(+2.44)#97 | 8.1%(+2.93)#4,375 |
| 98. | 07460 | 10.9% | 8.6%(+2.38)#98 | 8.1%(+2.87)#4,433 |
| 99. | 07106 | 10.9% | 8.6%(+2.35)#99 | 8.1%(+2.84)#4,469 |
| 100. | 08051 | 10.9% | 8.6%(+2.34)#100 | 8.1%(+2.83)#4,472 |
Common Questions
What are the Top 10 Zip Codes with the Highest Percentage of Population with a Degree in Social Sciences in New Jersey?
Top 10 Zip Codes with the Highest Percentage of Population with a Degree in Social Sciences in New Jersey are:
What zip code has the Highest Percentage of Population with a Degree in Social Sciences in New Jersey?
07870 has the Highest Percentage of Population with a Degree in Social Sciences in New Jersey with 100.0%.
What is the Percentage of Population with a Degree in Social Sciences in the State of New Jersey?
Percentage of Population with a Degree in Social Sciences in New Jersey is 8.6%.
What is the Percentage of Population with a Degree in Social Sciences in the United States?
Percentage of Population with a Degree in Social Sciences in the United States is 8.1%.