Zip Codes with the Highest Percentage of Population with a Degree in Science and Engineering in New Jersey
RELATED REPORTS & OPTIONS
Science and Engineering
New Jersey
Compare Zip Codes
Map of Zip Codes with the Highest Percentage of Population with a Degree in Science and Engineering in New Jersey
0.0%
80.0%
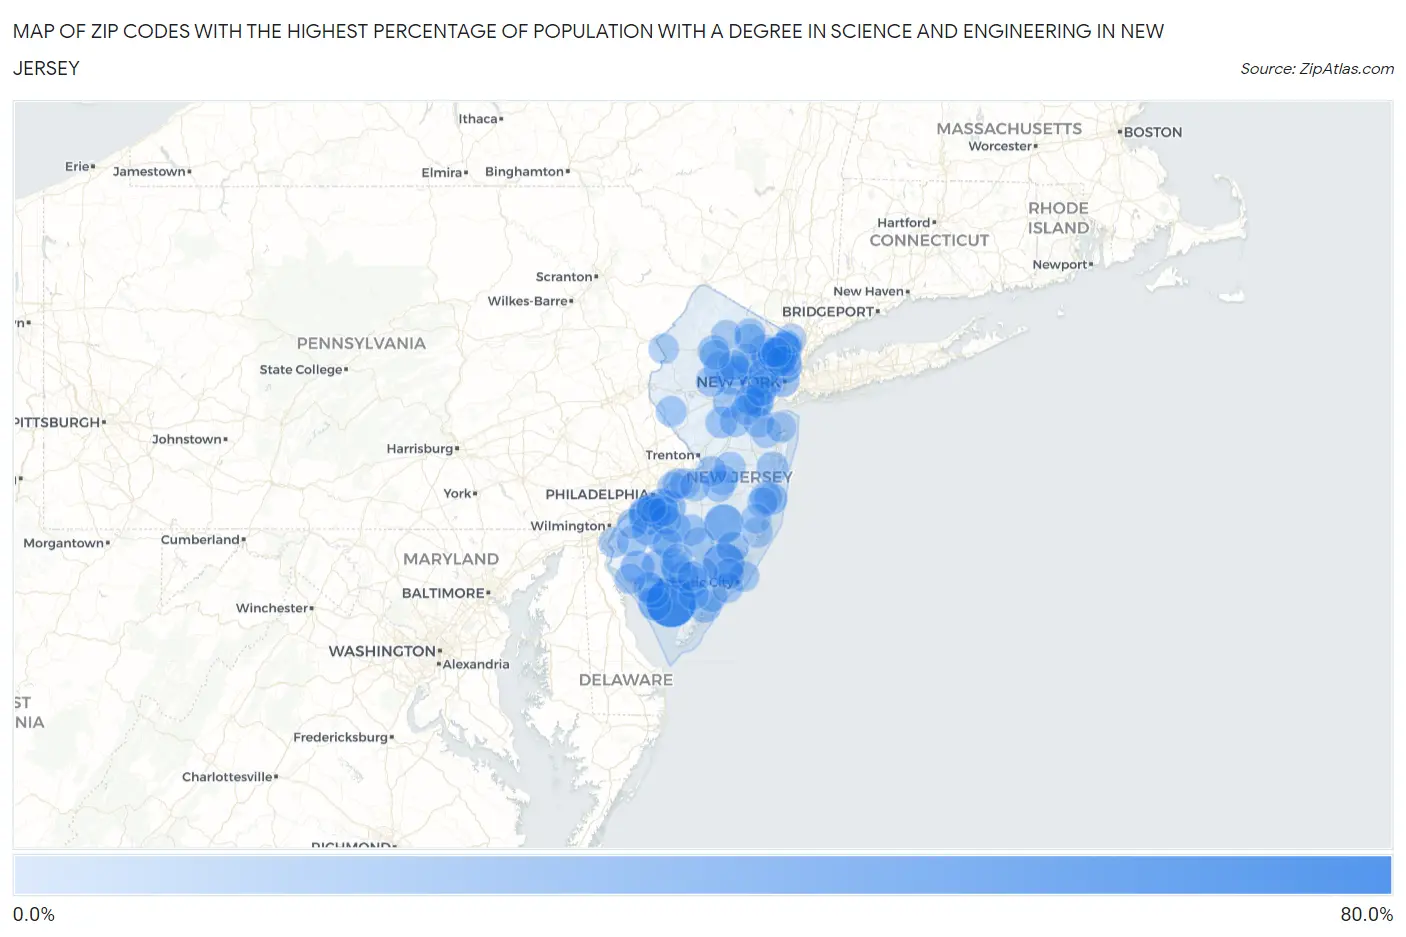
Zip Codes with the Highest Percentage of Population with a Degree in Science and Engineering in New Jersey
| Zip Code | % Graduates | vs State | vs National | |
| 1. | 08324 | 75.0% | 8.8% (+66.2)#1 | 9.8% (+65.2)#153 |
| 2. | 08240 | 47.7% | 8.8% (+38.8)#2 | 9.8% (+37.9)#457 |
| 3. | 08019 | 39.3% | 8.8% (+30.4)#3 | 9.8% (+29.5)#704 |
| 4. | 08061 | 34.2% | 8.8% (+25.3)#4 | 9.8% (+24.4)#985 |
| 5. | 08045 | 25.1% | 8.8% (+16.2)#5 | 9.8% (+15.3)#1,926 |
| 6. | 07311 | 24.3% | 8.8% (+15.5)#6 | 9.8% (+14.6)#2,092 |
| 7. | 07022 | 24.2% | 8.8% (+15.4)#7 | 9.8% (+14.5)#2,110 |
| 8. | 08353 | 23.3% | 8.8% (+14.4)#8 | 9.8% (+13.5)#2,325 |
| 9. | 08321 | 22.2% | 8.8% (+13.4)#9 | 9.8% (+12.4)#2,604 |
| 10. | 07621 | 21.0% | 8.8% (+12.2)#10 | 9.8% (+11.2)#2,964 |
| 11. | 08059 | 20.2% | 8.8% (+11.4)#11 | 9.8% (+10.4)#3,270 |
| 12. | 08230 | 19.9% | 8.8% (+11.0)#12 | 9.8% (+10.1)#3,424 |
| 13. | 07976 | 19.6% | 8.8% (+10.7)#13 | 9.8% (+9.77)#3,540 |
| 14. | 07646 | 19.4% | 8.8% (+10.6)#14 | 9.8% (+9.63)#3,608 |
| 15. | 08740 | 19.1% | 8.8% (+10.3)#15 | 9.8% (+9.33)#3,749 |
| 16. | 08352 | 19.0% | 8.8% (+10.1)#16 | 9.8% (+9.18)#3,817 |
| 17. | 07607 | 18.9% | 8.8% (+10.1)#17 | 9.8% (+9.13)#3,843 |
| 18. | 08741 | 18.3% | 8.8% (+9.45)#18 | 9.8% (+8.50)#4,141 |
| 19. | 08224 | 18.2% | 8.8% (+9.35)#19 | 9.8% (+8.40)#4,221 |
| 20. | 07970 | 17.3% | 8.8% (+8.44)#20 | 9.8% (+7.48)#4,753 |
| 21. | 08720 | 17.1% | 8.8% (+8.30)#21 | 9.8% (+7.35)#4,839 |
| 22. | 07001 | 16.9% | 8.8% (+8.05)#22 | 9.8% (+7.10)#5,039 |
| 23. | 07856 | 16.8% | 8.8% (+8.01)#23 | 9.8% (+7.06)#5,085 |
| 24. | 08066 | 16.8% | 8.8% (+7.95)#24 | 9.8% (+7.00)#5,127 |
| 25. | 08823 | 16.5% | 8.8% (+7.68)#25 | 9.8% (+6.73)#5,345 |
| 26. | 08846 | 16.2% | 8.8% (+7.33)#26 | 9.8% (+6.38)#5,617 |
| 27. | 08640 | 16.0% | 8.8% (+7.21)#27 | 9.8% (+6.26)#5,701 |
| 28. | 08345 | 16.0% | 8.8% (+7.17)#28 | 9.8% (+6.22)#5,733 |
| 29. | 08223 | 15.9% | 8.8% (+7.08)#29 | 9.8% (+6.12)#5,797 |
| 30. | 07628 | 15.8% | 8.8% (+6.97)#30 | 9.8% (+6.02)#5,886 |
| 31. | 08312 | 15.8% | 8.8% (+6.94)#31 | 9.8% (+5.99)#5,920 |
| 32. | 08081 | 15.6% | 8.8% (+6.73)#32 | 9.8% (+5.78)#6,127 |
| 33. | 07606 | 15.1% | 8.8% (+6.29)#33 | 9.8% (+5.34)#6,579 |
| 34. | 08514 | 15.1% | 8.8% (+6.29)#34 | 9.8% (+5.34)#6,585 |
| 35. | 08319 | 15.1% | 8.8% (+6.29)#35 | 9.8% (+5.33)#6,588 |
| 36. | 08850 | 15.1% | 8.8% (+6.22)#36 | 9.8% (+5.27)#6,651 |
| 37. | 08311 | 15.0% | 8.8% (+6.21)#37 | 9.8% (+5.26)#6,672 |
| 38. | 08089 | 15.0% | 8.8% (+6.16)#38 | 9.8% (+5.21)#6,738 |
| 39. | 07068 | 15.0% | 8.8% (+6.14)#39 | 9.8% (+5.18)#6,761 |
| 40. | 07977 | 14.6% | 8.8% (+5.78)#40 | 9.8% (+4.83)#7,107 |
| 41. | 07522 | 14.4% | 8.8% (+5.59)#41 | 9.8% (+4.64)#7,331 |
| 42. | 08203 | 14.4% | 8.8% (+5.58)#42 | 9.8% (+4.63)#7,339 |
| 43. | 07064 | 14.4% | 8.8% (+5.54)#43 | 9.8% (+4.59)#7,375 |
| 44. | 07420 | 14.3% | 8.8% (+5.49)#44 | 9.8% (+4.54)#7,430 |
| 45. | 07961 | 14.3% | 8.8% (+5.45)#45 | 9.8% (+4.50)#7,498 |
| 46. | 08825 | 14.3% | 8.8% (+5.45)#46 | 9.8% (+4.50)#7,537 |
| 47. | 07114 | 14.1% | 8.8% (+5.31)#47 | 9.8% (+4.36)#7,679 |
| 48. | 08037 | 14.1% | 8.8% (+5.23)#48 | 9.8% (+4.28)#7,779 |
| 49. | 08511 | 13.9% | 8.8% (+5.11)#49 | 9.8% (+4.16)#7,930 |
| 50. | 08062 | 13.9% | 8.8% (+5.05)#50 | 9.8% (+4.10)#8,011 |
| 51. | 08086 | 13.8% | 8.8% (+5.00)#51 | 9.8% (+4.05)#8,092 |
| 52. | 08402 | 13.8% | 8.8% (+4.93)#52 | 9.8% (+3.98)#8,178 |
| 53. | 08201 | 13.7% | 8.8% (+4.86)#53 | 9.8% (+3.91)#8,249 |
| 54. | 08330 | 13.7% | 8.8% (+4.86)#54 | 9.8% (+3.91)#8,261 |
| 55. | 08098 | 13.6% | 8.8% (+4.81)#55 | 9.8% (+3.86)#8,313 |
| 56. | 08096 | 13.6% | 8.8% (+4.76)#56 | 9.8% (+3.81)#8,392 |
| 57. | 07008 | 13.6% | 8.8% (+4.75)#57 | 9.8% (+3.80)#8,400 |
| 58. | 07603 | 13.4% | 8.8% (+4.53)#58 | 9.8% (+3.57)#8,691 |
| 59. | 07083 | 13.3% | 8.8% (+4.51)#59 | 9.8% (+3.56)#8,707 |
| 60. | 08050 | 13.3% | 8.8% (+4.44)#60 | 9.8% (+3.49)#8,831 |
| 61. | 07733 | 13.2% | 8.8% (+4.38)#61 | 9.8% (+3.43)#8,902 |
| 62. | 08515 | 13.2% | 8.8% (+4.38)#62 | 9.8% (+3.43)#8,907 |
| 63. | 08721 | 13.2% | 8.8% (+4.33)#63 | 9.8% (+3.38)#8,986 |
| 64. | 07058 | 13.1% | 8.8% (+4.26)#64 | 9.8% (+3.31)#9,106 |
| 65. | 08077 | 12.9% | 8.8% (+4.05)#65 | 9.8% (+3.10)#9,431 |
| 66. | 08046 | 12.8% | 8.8% (+4.01)#66 | 9.8% (+3.06)#9,491 |
| 67. | 08360 | 12.8% | 8.8% (+3.97)#67 | 9.8% (+3.02)#9,545 |
| 68. | 08075 | 12.8% | 8.8% (+3.96)#68 | 9.8% (+3.01)#9,575 |
| 69. | 08340 | 12.8% | 8.8% (+3.94)#69 | 9.8% (+2.99)#9,592 |
| 70. | 08323 | 12.8% | 8.8% (+3.92)#70 | 9.8% (+2.97)#9,624 |
| 71. | 07721 | 12.7% | 8.8% (+3.87)#71 | 9.8% (+2.92)#9,695 |
| 72. | 08012 | 12.6% | 8.8% (+3.80)#72 | 9.8% (+2.85)#9,812 |
| 73. | 08070 | 12.6% | 8.8% (+3.75)#73 | 9.8% (+2.80)#9,885 |
| 74. | 08029 | 12.5% | 8.8% (+3.66)#74 | 9.8% (+2.71)#10,079 |
| 75. | 07013 | 12.4% | 8.8% (+3.60)#75 | 9.8% (+2.65)#10,156 |
| 76. | 07832 | 12.4% | 8.8% (+3.59)#76 | 9.8% (+2.64)#10,168 |
| 77. | 08361 | 12.4% | 8.8% (+3.57)#77 | 9.8% (+2.62)#10,194 |
| 78. | 07026 | 12.4% | 8.8% (+3.57)#78 | 9.8% (+2.62)#10,196 |
| 79. | 07107 | 12.4% | 8.8% (+3.54)#79 | 9.8% (+2.59)#10,247 |
| 80. | 07650 | 12.4% | 8.8% (+3.52)#80 | 9.8% (+2.57)#10,266 |
| 81. | 07407 | 12.3% | 8.8% (+3.49)#81 | 9.8% (+2.54)#10,321 |
| 82. | 07067 | 12.3% | 8.8% (+3.48)#82 | 9.8% (+2.53)#10,350 |
| 83. | 08837 | 12.3% | 8.8% (+3.47)#83 | 9.8% (+2.52)#10,361 |
| 84. | 08270 | 12.3% | 8.8% (+3.43)#84 | 9.8% (+2.48)#10,439 |
| 85. | 07648 | 12.2% | 8.8% (+3.38)#85 | 9.8% (+2.43)#10,508 |
| 86. | 07643 | 12.2% | 8.8% (+3.37)#86 | 9.8% (+2.42)#10,521 |
| 87. | 08085 | 12.2% | 8.8% (+3.37)#87 | 9.8% (+2.42)#10,527 |
| 88. | 08322 | 12.2% | 8.8% (+3.36)#88 | 9.8% (+2.41)#10,555 |
| 89. | 07927 | 12.1% | 8.8% (+3.30)#89 | 9.8% (+2.35)#10,673 |
| 90. | 08341 | 12.0% | 8.8% (+3.22)#90 | 9.8% (+2.27)#10,811 |
| 91. | 08060 | 12.0% | 8.8% (+3.21)#91 | 9.8% (+2.26)#10,822 |
| 92. | 08758 | 12.0% | 8.8% (+3.18)#92 | 9.8% (+2.23)#10,869 |
| 93. | 08317 | 11.9% | 8.8% (+3.11)#93 | 9.8% (+2.16)#10,996 |
| 94. | 07457 | 11.9% | 8.8% (+3.10)#94 | 9.8% (+2.15)#11,015 |
| 95. | 07438 | 11.9% | 8.8% (+3.10)#95 | 9.8% (+2.15)#11,017 |
| 96. | 07716 | 11.9% | 8.8% (+3.08)#96 | 9.8% (+2.13)#11,054 |
| 97. | 08063 | 11.9% | 8.8% (+3.08)#97 | 9.8% (+2.13)#11,055 |
| 98. | 07202 | 11.9% | 8.8% (+3.07)#98 | 9.8% (+2.12)#11,068 |
| 99. | 07662 | 11.9% | 8.8% (+3.05)#99 | 9.8% (+2.10)#11,120 |
| 100. | 07847 | 11.9% | 8.8% (+3.03)#100 | 9.8% (+2.08)#11,149 |
Common Questions
What are the Top 10 Zip Codes with the Highest Percentage of Population with a Degree in Science and Engineering in New Jersey?
Top 10 Zip Codes with the Highest Percentage of Population with a Degree in Science and Engineering in New Jersey are:
What zip code has the Highest Percentage of Population with a Degree in Science and Engineering in New Jersey?
08324 has the Highest Percentage of Population with a Degree in Science and Engineering in New Jersey with 75.0%.
What is the Percentage of Population with a Degree in Science and Engineering in the State of New Jersey?
Percentage of Population with a Degree in Science and Engineering in New Jersey is 8.8%.
What is the Percentage of Population with a Degree in Science and Engineering in the United States?
Percentage of Population with a Degree in Science and Engineering in the United States is 9.8%.