Zip Codes with the Highest Percentage of Families with Income Above $100,000 in New Jersey
RELATED REPORTS & OPTIONS
Family Income | $100k+
New Jersey
Compare Zip Codes
Map of Zip Codes with the Highest Percentage of Families with Income Above $100,000 in New Jersey
70.0%
100.0%
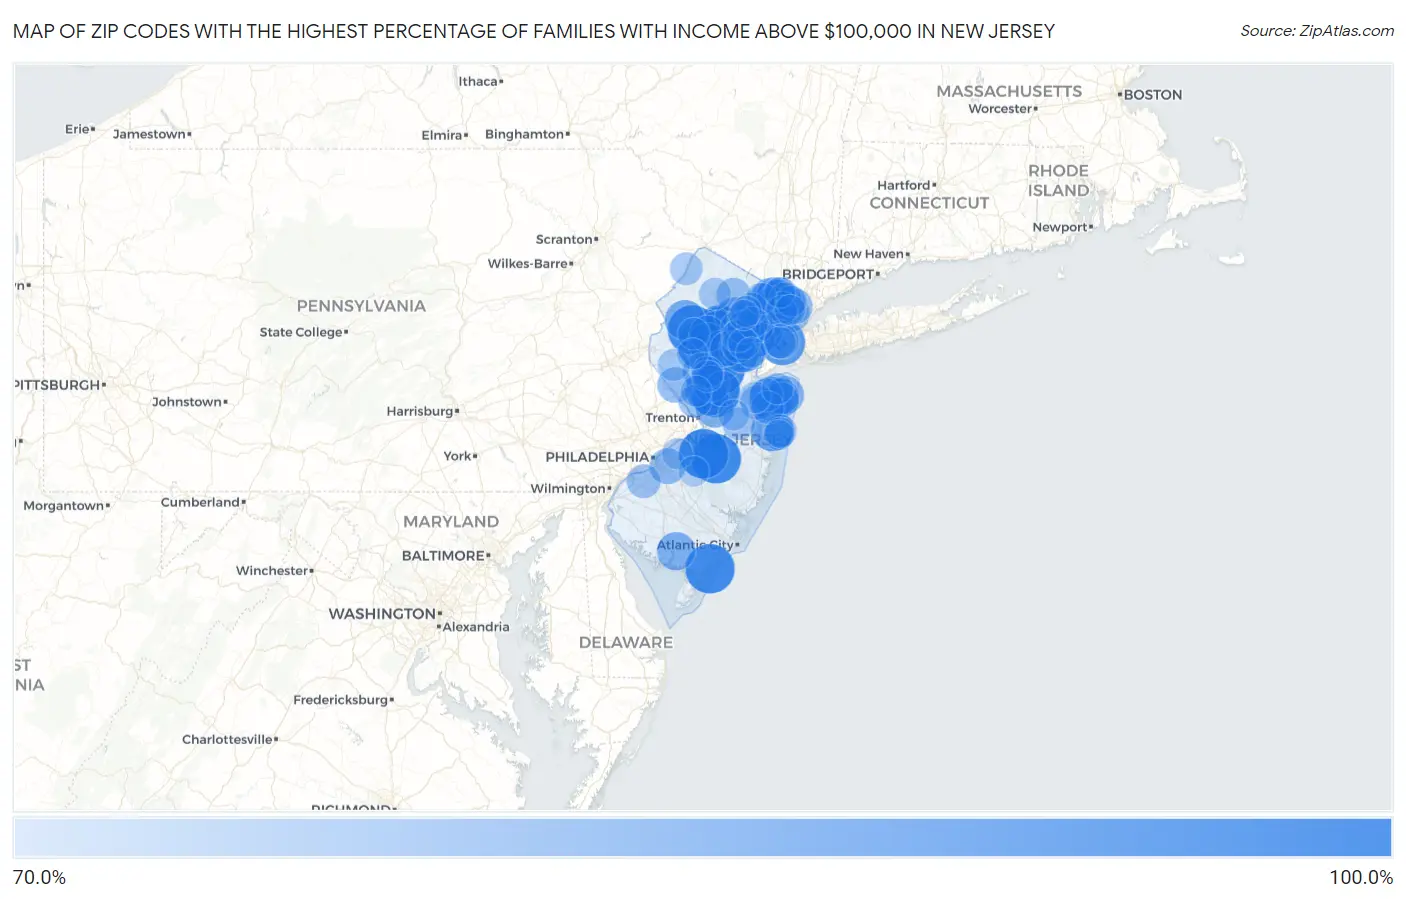
Zip Codes with the Highest Percentage of Families with Income Above $100,000 in New Jersey
| Zip Code | Families with Income > $100k | vs State | vs National | |
| 1. | 07970 | 100.0% | 58.5% (+41.5)#1 | 46.1% (+53.9)#46 |
| 2. | 07979 | 100.0% | 58.5% (+41.5)#2 | 46.1% (+53.9)#50 |
| 3. | 08528 | 100.0% | 58.5% (+41.5)#3 | 46.1% (+53.9)#80 |
| 4. | 08248 | 100.0% | 58.5% (+41.5)#4 | 46.1% (+53.9)#111 |
| 5. | 08890 | 100.0% | 58.5% (+41.5)#5 | 46.1% (+53.9)#160 |
| 6. | 07926 | 100.0% | 58.5% (+41.5)#6 | 46.1% (+53.9)#165 |
| 7. | 08064 | 100.0% | 58.5% (+41.5)#7 | 46.1% (+53.9)#174 |
| 8. | 08011 | 100.0% | 58.5% (+41.5)#8 | 46.1% (+53.9)#189 |
| 9. | 07870 | 100.0% | 58.5% (+41.5)#9 | 46.1% (+53.9)#228 |
| 10. | 07311 | 95.6% | 58.5% (+37.1)#10 | 46.1% (+49.5)#284 |
| 11. | 07738 | 93.7% | 58.5% (+35.2)#11 | 46.1% (+47.6)#302 |
| 12. | 07945 | 93.4% | 58.5% (+34.9)#12 | 46.1% (+47.3)#306 |
| 13. | 07078 | 93.3% | 58.5% (+34.8)#13 | 46.1% (+47.2)#307 |
| 14. | 08720 | 92.4% | 58.5% (+33.9)#14 | 46.1% (+46.3)#320 |
| 15. | 07028 | 91.4% | 58.5% (+32.9)#15 | 46.1% (+45.3)#332 |
| 16. | 08558 | 91.4% | 58.5% (+32.9)#16 | 46.1% (+45.3)#333 |
| 17. | 07423 | 90.3% | 58.5% (+31.8)#17 | 46.1% (+44.2)#354 |
| 18. | 07046 | 89.9% | 58.5% (+31.4)#18 | 46.1% (+43.8)#363 |
| 19. | 07880 | 89.8% | 58.5% (+31.3)#19 | 46.1% (+43.7)#366 |
| 20. | 07934 | 89.0% | 58.5% (+30.5)#20 | 46.1% (+42.9)#393 |
| 21. | 07021 | 88.6% | 58.5% (+30.1)#21 | 46.1% (+42.5)#402 |
| 22. | 07058 | 88.1% | 58.5% (+29.6)#22 | 46.1% (+42.0)#423 |
| 23. | 07043 | 88.0% | 58.5% (+29.5)#23 | 46.1% (+41.9)#426 |
| 24. | 08836 | 87.9% | 58.5% (+29.4)#24 | 46.1% (+41.8)#433 |
| 25. | 08348 | 87.9% | 58.5% (+29.4)#25 | 46.1% (+41.8)#434 |
| 26. | 07760 | 87.6% | 58.5% (+29.1)#26 | 46.1% (+41.5)#448 |
| 27. | 07090 | 87.4% | 58.5% (+28.9)#27 | 46.1% (+41.3)#456 |
| 28. | 08550 | 87.4% | 58.5% (+28.9)#28 | 46.1% (+41.3)#457 |
| 29. | 07641 | 87.3% | 58.5% (+28.8)#29 | 46.1% (+41.2)#462 |
| 30. | 07920 | 86.6% | 58.5% (+28.1)#30 | 46.1% (+40.5)#493 |
| 31. | 07079 | 86.5% | 58.5% (+28.0)#31 | 46.1% (+40.4)#500 |
| 32. | 08853 | 86.3% | 58.5% (+27.8)#32 | 46.1% (+40.2)#511 |
| 33. | 07928 | 86.2% | 58.5% (+27.7)#33 | 46.1% (+40.1)#517 |
| 34. | 07481 | 86.2% | 58.5% (+27.7)#34 | 46.1% (+40.1)#518 |
| 35. | 07670 | 86.1% | 58.5% (+27.6)#35 | 46.1% (+40.0)#523 |
| 36. | 08542 | 86.0% | 58.5% (+27.5)#36 | 46.1% (+39.9)#535 |
| 37. | 08502 | 85.9% | 58.5% (+27.4)#37 | 46.1% (+39.8)#539 |
| 38. | 07401 | 85.9% | 58.5% (+27.4)#38 | 46.1% (+39.8)#541 |
| 39. | 07930 | 85.8% | 58.5% (+27.3)#39 | 46.1% (+39.7)#547 |
| 40. | 07922 | 85.7% | 58.5% (+27.2)#40 | 46.1% (+39.6)#553 |
| 41. | 07452 | 85.4% | 58.5% (+26.9)#41 | 46.1% (+39.3)#567 |
| 42. | 07704 | 85.4% | 58.5% (+26.9)#42 | 46.1% (+39.3)#569 |
| 43. | 08033 | 85.3% | 58.5% (+26.8)#43 | 46.1% (+39.2)#573 |
| 44. | 07640 | 85.0% | 58.5% (+26.5)#44 | 46.1% (+38.9)#591 |
| 45. | 07739 | 84.9% | 58.5% (+26.4)#45 | 46.1% (+38.8)#600 |
| 46. | 08559 | 84.8% | 58.5% (+26.3)#46 | 46.1% (+38.7)#606 |
| 47. | 08824 | 84.7% | 58.5% (+26.2)#47 | 46.1% (+38.6)#611 |
| 48. | 07620 | 84.7% | 58.5% (+26.2)#48 | 46.1% (+38.6)#614 |
| 49. | 07076 | 84.5% | 58.5% (+26.0)#49 | 46.1% (+38.4)#625 |
| 50. | 07039 | 84.4% | 58.5% (+25.9)#50 | 46.1% (+38.3)#633 |
| 51. | 07656 | 84.4% | 58.5% (+25.9)#51 | 46.1% (+38.3)#637 |
| 52. | 07023 | 84.3% | 58.5% (+25.8)#52 | 46.1% (+38.2)#644 |
| 53. | 07946 | 84.3% | 58.5% (+25.8)#53 | 46.1% (+38.2)#646 |
| 54. | 07310 | 84.1% | 58.5% (+25.6)#54 | 46.1% (+38.0)#658 |
| 55. | 07450 | 83.9% | 58.5% (+25.4)#55 | 46.1% (+37.8)#675 |
| 56. | 07746 | 83.7% | 58.5% (+25.2)#56 | 46.1% (+37.6)#691 |
| 57. | 07435 | 83.6% | 58.5% (+25.1)#57 | 46.1% (+37.5)#698 |
| 58. | 07981 | 83.1% | 58.5% (+24.6)#58 | 46.1% (+37.0)#733 |
| 59. | 08056 | 83.0% | 58.5% (+24.5)#59 | 46.1% (+36.9)#739 |
| 60. | 07974 | 82.7% | 58.5% (+24.2)#60 | 46.1% (+36.6)#753 |
| 61. | 07932 | 82.6% | 58.5% (+24.1)#61 | 46.1% (+36.5)#765 |
| 62. | 07677 | 82.6% | 58.5% (+24.1)#62 | 46.1% (+36.5)#769 |
| 63. | 08750 | 82.5% | 58.5% (+24.0)#63 | 46.1% (+36.4)#776 |
| 64. | 07733 | 82.4% | 58.5% (+23.9)#64 | 46.1% (+36.3)#780 |
| 65. | 08534 | 82.2% | 58.5% (+23.7)#65 | 46.1% (+36.1)#796 |
| 66. | 07458 | 82.2% | 58.5% (+23.7)#66 | 46.1% (+36.1)#797 |
| 67. | 07722 | 82.2% | 58.5% (+23.7)#67 | 46.1% (+36.1)#798 |
| 68. | 07675 | 81.9% | 58.5% (+23.4)#68 | 46.1% (+35.8)#812 |
| 69. | 07044 | 81.9% | 58.5% (+23.4)#69 | 46.1% (+35.8)#815 |
| 70. | 07936 | 81.8% | 58.5% (+23.3)#70 | 46.1% (+35.7)#825 |
| 71. | 07851 | 81.8% | 58.5% (+23.3)#71 | 46.1% (+35.7)#829 |
| 72. | 08510 | 81.7% | 58.5% (+23.2)#72 | 46.1% (+35.6)#844 |
| 73. | 07440 | 81.5% | 58.5% (+23.0)#73 | 46.1% (+35.4)#864 |
| 74. | 08821 | 81.4% | 58.5% (+22.9)#74 | 46.1% (+35.3)#873 |
| 75. | 07940 | 81.3% | 58.5% (+22.8)#75 | 46.1% (+35.2)#880 |
| 76. | 07871 | 81.0% | 58.5% (+22.5)#76 | 46.1% (+34.9)#913 |
| 77. | 08867 | 81.0% | 58.5% (+22.5)#77 | 46.1% (+34.9)#915 |
| 78. | 07853 | 80.9% | 58.5% (+22.4)#78 | 46.1% (+34.8)#924 |
| 79. | 07302 | 80.8% | 58.5% (+22.3)#79 | 46.1% (+34.7)#929 |
| 80. | 08844 | 80.8% | 58.5% (+22.3)#80 | 46.1% (+34.7)#930 |
| 81. | 07649 | 80.8% | 58.5% (+22.3)#81 | 46.1% (+34.7)#942 |
| 82. | 07751 | 80.7% | 58.5% (+22.2)#82 | 46.1% (+34.6)#953 |
| 83. | 07417 | 80.7% | 58.5% (+22.2)#83 | 46.1% (+34.6)#957 |
| 84. | 07737 | 80.6% | 58.5% (+22.1)#84 | 46.1% (+34.5)#968 |
| 85. | 07006 | 80.5% | 58.5% (+22.0)#85 | 46.1% (+34.4)#973 |
| 86. | 07901 | 80.3% | 58.5% (+21.8)#86 | 46.1% (+34.2)#988 |
| 87. | 07661 | 80.3% | 58.5% (+21.8)#87 | 46.1% (+34.2)#991 |
| 88. | 08833 | 80.3% | 58.5% (+21.8)#88 | 46.1% (+34.2)#992 |
| 89. | 08057 | 80.2% | 58.5% (+21.7)#89 | 46.1% (+34.1)#1,003 |
| 90. | 08525 | 80.2% | 58.5% (+21.7)#90 | 46.1% (+34.1)#1,011 |
| 91. | 07082 | 80.1% | 58.5% (+21.6)#91 | 46.1% (+34.0)#1,019 |
| 92. | 08535 | 80.1% | 58.5% (+21.6)#92 | 46.1% (+34.0)#1,020 |
| 93. | 07648 | 80.0% | 58.5% (+21.5)#93 | 46.1% (+33.9)#1,029 |
| 94. | 08055 | 79.6% | 58.5% (+21.1)#94 | 46.1% (+33.5)#1,066 |
| 95. | 07016 | 79.6% | 58.5% (+21.1)#95 | 46.1% (+33.5)#1,067 |
| 96. | 07645 | 79.6% | 58.5% (+21.1)#96 | 46.1% (+33.5)#1,069 |
| 97. | 07045 | 79.5% | 58.5% (+21.0)#97 | 46.1% (+33.4)#1,082 |
| 98. | 07626 | 79.5% | 58.5% (+21.0)#98 | 46.1% (+33.4)#1,083 |
| 99. | 08736 | 79.4% | 58.5% (+20.9)#99 | 46.1% (+33.3)#1,090 |
| 100. | 08730 | 79.4% | 58.5% (+20.9)#100 | 46.1% (+33.3)#1,095 |
Common Questions
What are the Top 10 Zip Codes with the Highest Percentage of Families with Income Above $100,000 in New Jersey?
Top 10 Zip Codes with the Highest Percentage of Families with Income Above $100,000 in New Jersey are:
What zip code has the Highest Percentage of Families with Income Above $100,000 in New Jersey?
07970 has the Highest Percentage of Families with Income Above $100,000 in New Jersey with 100.0%.
What is the Percentage of Families with Income Above $100,000 in the State of New Jersey?
Percentage of Families with Income Above $100,000 in New Jersey is 58.5%.
What is the Percentage of Families with Income Above $100,000 in the United States?
Percentage of Families with Income Above $100,000 in the United States is 46.1%.