Zip Codes with the Highest Percentage of Population Employed in Security & Protection in Kansas City, MO

RELATED REPORTS & OPTIONS

Security & Protection
Population
Families and Households
Female Fertility
Female Fertility (Unmarried)
Race (Community Size)
Race (Percentage)
Ancestry (Community Size)
AfghanAfricanAlaska NativeAlbanianAmericanApacheArabArgentineanArmenianAustralianAustrianBahamianBangladeshiBelgianBelizeanBhutaneseBlackfeetBolivianBrazilianBritishBulgarianBurmeseCanadianCelticCentral AmericanCentral American IndianCherokeeChickasawChileanChippewaChoctawColombianComancheCosta RicanCreeCreekCroatianCrowCubanCzechCzechoslovakianDanishDominicanDutchDutch West IndianEastern EuropeanEcuadorianEgyptianEnglishEthiopianEuropeanFijianFilipinoFinnishFrenchFrench American IndianFrench CanadianGermanGerman RussianGhanaianGreekGuamanian / ChamorroGuatemalanGuyaneseHaitianHonduranHungarianIcelanderIndian (Asian)IndonesianIranianIraqiIrishIroquoisIsraeliItalianJamaicanJapaneseJordanianKenyanKoreanLaotianLatvianLebaneseLiberianLithuanianLuxembourgerMalaysianMexicanMexican American IndianMongolianMoroccanNative HawaiianNavajoNew ZealanderNicaraguanNigerianNorthern EuropeanNorwegianOsageOttawaPakistaniPalestinianPanamanianPennsylvania GermanPeruvianPolishPortuguesePotawatomiPuebloPuerto RicanRomanianRussianSalvadoranSamoanScandinavianScotch-IrishScottishSeminoleSerbianShoshoneSierra LeoneanSiouxSlavicSlovakSloveneSomaliSouth AfricanSouth AmericanSouth American IndianSpaniardSpanishSri LankanSubsaharan AfricanSudaneseSwedishSwissSyrianThaiTrinidadian and TobagonianTurkishUgandanUkrainianUruguayanVenezuelanVietnameseWelshWest IndianYugoslavian
Ancestry (Percentage)
AfghanAfricanAlaska NativeAlbanianAmericanApacheArabArgentineanArmenianAustralianAustrianBahamianBangladeshiBelgianBelizeanBhutaneseBlackfeetBolivianBrazilianBritishBulgarianBurmeseCanadianCelticCentral AmericanCentral American IndianCherokeeChickasawChileanChippewaChoctawColombianComancheCosta RicanCreeCreekCroatianCrowCubanCzechCzechoslovakianDanishDominicanDutchDutch West IndianEastern EuropeanEcuadorianEgyptianEnglishEthiopianEuropeanFijianFilipinoFinnishFrenchFrench American IndianFrench CanadianGermanGerman RussianGhanaianGreekGuamanian / ChamorroGuatemalanGuyaneseHaitianHonduranHungarianIcelanderIndian (Asian)IndonesianIranianIraqiIrishIroquoisIsraeliItalianJamaicanJapaneseJordanianKenyanKoreanLaotianLatvianLebaneseLiberianLithuanianLuxembourgerMalaysianMexicanMexican American IndianMongolianMoroccanNative HawaiianNavajoNew ZealanderNicaraguanNigerianNorthern EuropeanNorwegianOsageOttawaPakistaniPalestinianPanamanianPennsylvania GermanPeruvianPolishPortuguesePotawatomiPuebloPuerto RicanRomanianRussianSalvadoranSamoanScandinavianScotch-IrishScottishSeminoleSerbianShoshoneSierra LeoneanSiouxSlavicSlovakSloveneSomaliSouth AfricanSouth AmericanSouth American IndianSpaniardSpanishSri LankanSubsaharan AfricanSudaneseSwedishSwissSyrianThaiTrinidadian and TobagonianTurkishUgandanUkrainianUruguayanVenezuelanVietnameseWelshWest IndianYugoslavian
Immigrant Origin (Total)
AfghanistanAfricaArgentinaAsiaAustraliaBahamasBangladeshBelarusBelgiumBelizeBoliviaBosnia and HerzegovinaBrazilBulgariaBurma / MyanmarCambodiaCameroonCanadaCaribbeanCentral AmericaChileChinaColombiaCongoCosta RicaCubaCzechoslovakiaDenmarkDominican RepublicEastern AfricaEastern AsiaEastern EuropeEcuadorEgyptEl SalvadorEnglandEritreaEthiopiaEuropeFijiFranceGermanyGhanaGreeceGuatemalaGuyanaHaitiHondurasHong KongHungaryIndiaIndonesiaIranIraqIrelandIsraelItalyJamaicaJapanJordanKazakhstanKenyaKoreaKuwaitLaosLatin AmericaLebanonLiberiaMalaysiaMexicoMicronesiaMiddle AfricaMoroccoNepalNetherlandsNicaraguaNigeriaNorthern AfricaNorthern EuropeOceaniaPakistanPeruPhilippinesPolandPortugalRomaniaRussiaSaudi ArabiaScotlandSierra LeoneSomaliaSouth AfricaSouth AmericaSouth Central AsiaSouth Eastern AsiaSouthern EuropeSpainSri LankaSudanSwedenSwitzerlandSyriaTaiwanThailandTrinidad and TobagoTurkeyUgandaUkraineUruguayVenezuelaVietnamWestern AfricaWestern AsiaWestern EuropeZaireZimbabwe
Immigrant Origin (Percentage)
AfghanistanAfricaArgentinaAsiaAustraliaBahamasBangladeshBelarusBelgiumBelizeBoliviaBosnia and HerzegovinaBrazilBulgariaBurma / MyanmarCambodiaCameroonCanadaCaribbeanCentral AmericaChileChinaColombiaCongoCosta RicaCubaCzechoslovakiaDenmarkDominican RepublicEastern AfricaEastern AsiaEastern EuropeEcuadorEgyptEl SalvadorEnglandEritreaEthiopiaEuropeFijiFranceGermanyGhanaGreeceGuatemalaGuyanaHaitiHondurasHong KongHungaryIndiaIndonesiaIranIraqIrelandIsraelItalyJamaicaJapanJordanKazakhstanKenyaKoreaKuwaitLaosLatin AmericaLebanonLiberiaMalaysiaMexicoMicronesiaMiddle AfricaMoroccoNepalNetherlandsNicaraguaNigeriaNorthern AfricaNorthern EuropeOceaniaPakistanPeruPhilippinesPolandPortugalRomaniaRussiaSaudi ArabiaScotlandSierra LeoneSomaliaSouth AfricaSouth AmericaSouth Central AsiaSouth Eastern AsiaSouthern EuropeSpainSri LankaSudanSwedenSwitzerlandSyriaTaiwanThailandTrinidad and TobagoTurkeyUgandaUkraineUruguayVenezuelaVietnamWestern AfricaWestern AsiaWestern EuropeZaireZimbabwe
Income
Income (Families)
Income (Households)
Poverty
Poverty (Families)
Unemployment
Employment Occupations
Employment Industries
Employer Class
Commute Time
Commute Means
School Enrollment
Education by Degree Field
Occupancy
Finances
Physical Characteristics
Kansas City
Compare Zip Codes
Comparison Subject

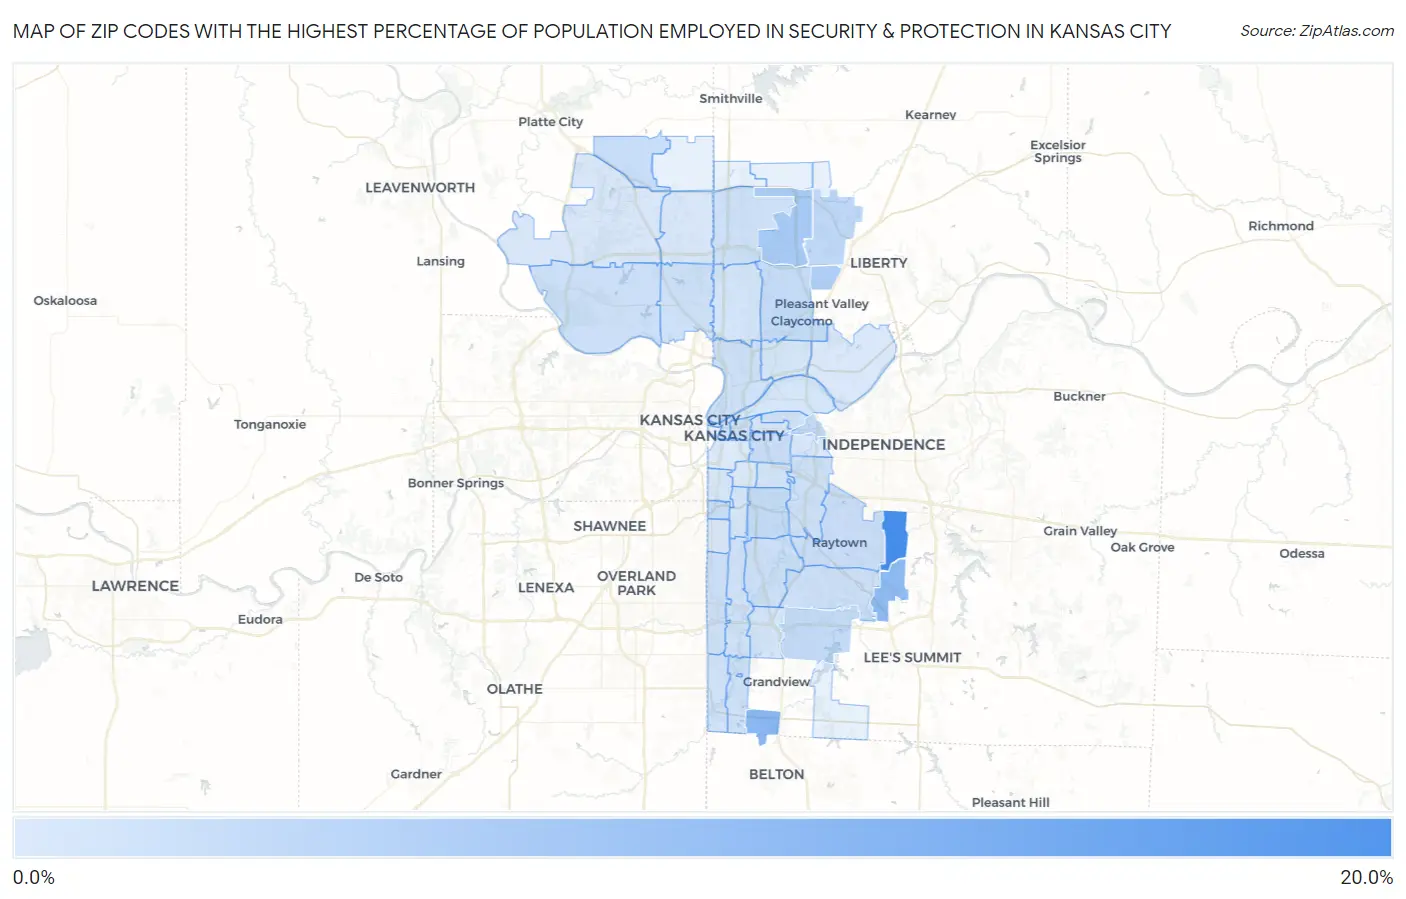
Map of Zip Codes with the Highest Percentage of Population Employed in Security & Protection in Kansas City

0.0%
20.0%
Zip Codes with the Highest Percentage of Population Employed in Security & Protection in Kansas City Map

Zip Codes with the Highest Percentage of Population Employed in Security & Protection in Kansas City, MO

Zip Code % Employed vs State vs National
1.6413619.4%1.9%(+17.5)#52.1%(+17.3)#211
2.6414710.6%1.9%(+8.70)#142.1%(+8.44)#693
3.641399.6%1.9%(+7.71)#192.1%(+7.46)#823
4.641566.8%1.9%(+4.94)#342.1%(+4.68)#1,617
5.641585.6%1.9%(+3.75)#492.1%(+3.49)#2,335
6.641574.0%1.9%(+2.08)#902.1%(+1.82)#4,555
7.641253.7%1.9%(+1.76)#1102.1%(+1.50)#5,274
8.641343.2%1.9%(+1.35)#1332.1%(+1.09)#6,423
9.641193.2%1.9%(+1.32)#1362.1%(+1.06)#6,522
10.641303.1%1.9%(+1.19)#1512.1%(+0.932)#6,958
11.641632.8%1.9%(+0.931)#1792.1%(+0.674)#8,005
12.641332.6%1.9%(+0.743)#2012.1%(+0.486)#8,850
13.641272.6%1.9%(+0.678)#2122.1%(+0.421)#9,161
14.641122.4%1.9%(+0.519)#2332.1%(+0.262)#10,005
15.641522.4%1.9%(+0.500)#2352.1%(+0.243)#10,095
16.641382.4%1.9%(+0.487)#2392.1%(+0.230)#10,174
17.641322.3%1.9%(+0.403)#2502.1%(+0.146)#10,673
18.641062.0%1.9%(+0.140)#2942.1%(-0.117)#12,357
19.641552.0%1.9%(+0.128)#2992.1%(-0.129)#12,431
20.641462.0%1.9%(+0.112)#3022.1%(-0.145)#12,544
21.641162.0%1.9%(+0.111)#3032.1%(-0.146)#12,545
22.641511.9%1.9%(+0.011)#3202.1%(-0.246)#13,201
23.641291.9%1.9%(-0.000)#3252.1%(-0.257)#13,290
24.641141.9%1.9%(-0.012)#3272.1%(-0.269)#13,381
25.641311.8%1.9%(-0.053)#3372.1%(-0.311)#13,663
26.641451.8%1.9%(-0.071)#3432.1%(-0.329)#13,785
27.641051.8%1.9%(-0.075)#3452.1%(-0.332)#13,807
28.641231.8%1.9%(-0.125)#3532.1%(-0.382)#14,182
29.641371.4%1.9%(-0.443)#4202.1%(-0.700)#16,593
30.641181.3%1.9%(-0.557)#4512.1%(-0.814)#17,459
31.641281.3%1.9%(-0.563)#4542.1%(-0.820)#17,507
32.641171.3%1.9%(-0.617)#4692.1%(-0.874)#17,949
33.641101.1%1.9%(-0.786)#5052.1%(-1.04)#19,241
34.641201.1%1.9%(-0.830)#5172.1%(-1.09)#19,571
35.641531.0%1.9%(-0.847)#5212.1%(-1.10)#19,701
36.641541.0%1.9%(-0.875)#5322.1%(-1.13)#19,911
37.641110.82%1.9%(-1.08)#5822.1%(-1.33)#21,326
38.641610.71%1.9%(-1.18)#6012.1%(-1.43)#21,970
39.641130.70%1.9%(-1.19)#6062.1%(-1.45)#22,063
40.641260.59%1.9%(-1.30)#6252.1%(-1.56)#22,716
41.641240.53%1.9%(-1.36)#6362.1%(-1.61)#23,052
42.641080.45%1.9%(-1.44)#6482.1%(-1.70)#23,493
43.641090.37%1.9%(-1.52)#6622.1%(-1.78)#23,863

Common Questions

What are the Top 10 Zip Codes with the Highest Percentage of Population Employed in Security & Protection in Kansas City, MO?
Top 10 Zip Codes with the Highest Percentage of Population Employed in Security & Protection in Kansas City, MO are:
#1
19.4%
#2
10.6%
#3
9.6%
#4
6.8%
#5
5.6%
#6
4.0%
#7
3.7%
#8
3.2%
#9
3.2%
#10
3.1%
What zip code has the Highest Percentage of Population Employed in Security & Protection in Kansas City, MO?
64136 has the Highest Percentage of Population Employed in Security & Protection in Kansas City, MO with 19.4%.
What is the Percentage of Population Employed in Security & Protection in Kansas City, MO?
Percentage of Population Employed in Security & Protection in Kansas City is 2.2%.
What is the Percentage of Population Employed in Security & Protection in Missouri?
Percentage of Population Employed in Security & Protection in Missouri is 1.9%.
What is the Percentage of Population Employed in Security & Protection in the United States?
Percentage of Population Employed in Security & Protection in the United States is 2.1%.