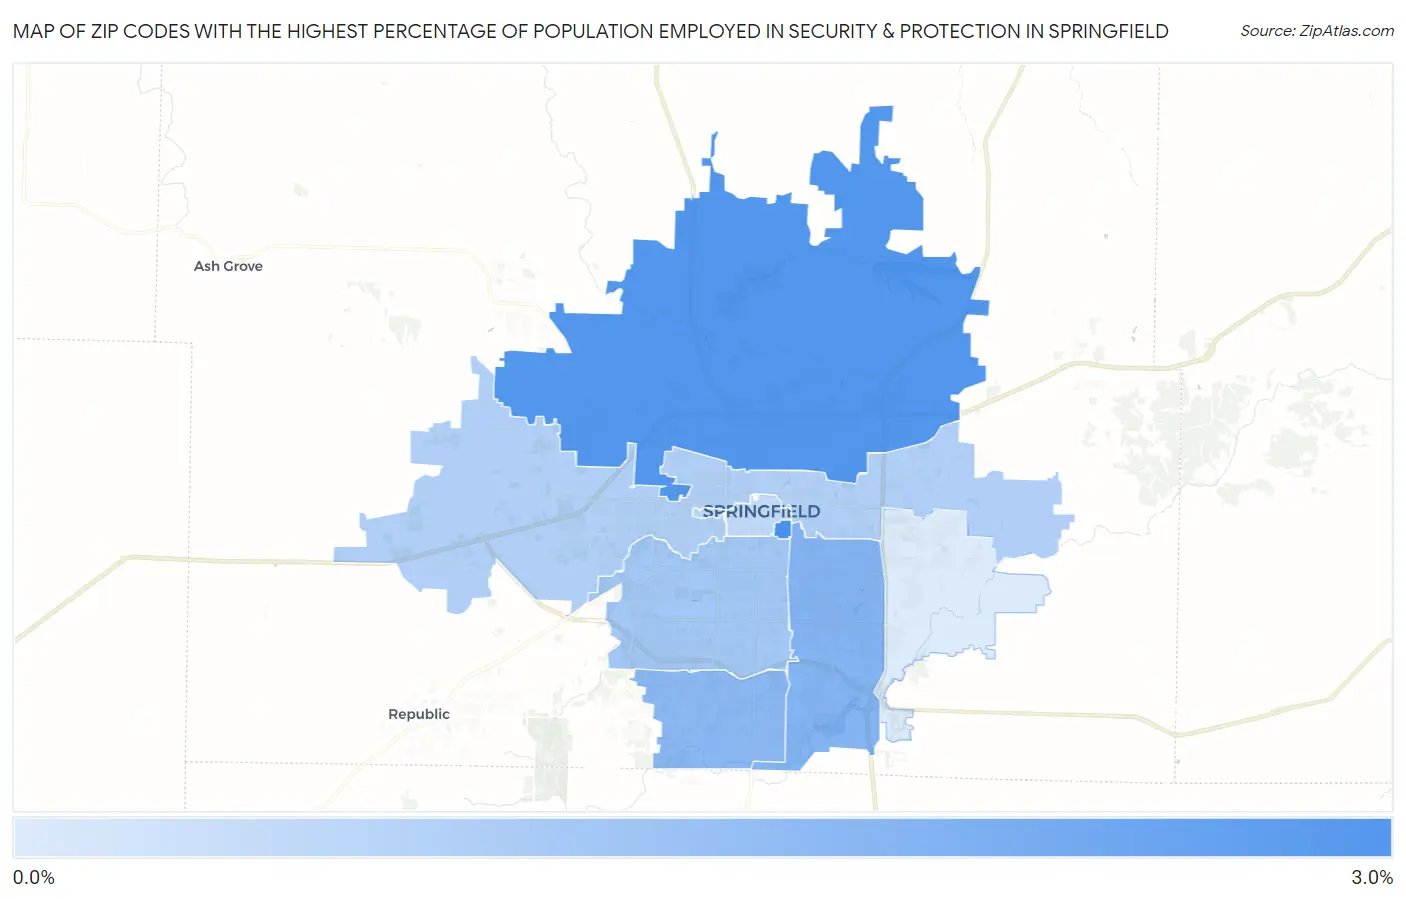
Zip Codes with the Highest Percentage of Population Employed in Security & Protection in Springfield, MO
RELATED REPORTS & OPTIONS
Security & Protection
Springfield
Compare Zip Codes
Map of Zip Codes with the Highest Percentage of Population Employed in Security & Protection in Springfield
0.69%
2.6%
Zip Codes with the Highest Percentage of Population Employed in Security & Protection in Springfield, MO
| Zip Code | % Employed | vs State | vs National | |
| 1. | 65897 | 2.6% | 1.9%(+0.663)#214 | 2.1%(+0.406)#9,227 |
| 2. | 65803 | 2.4% | 1.9%(+0.521)#232 | 2.1%(+0.264)#9,996 |
| 3. | 65804 | 1.8% | 1.9%(-0.090)#350 | 2.1%(-0.347)#13,942 |
| 4. | 65810 | 1.7% | 1.9%(-0.173)#364 | 2.1%(-0.430)#14,542 |
| 5. | 65807 | 1.4% | 1.9%(-0.497)#437 | 2.1%(-0.754)#16,993 |
| 6. | 65802 | 1.2% | 1.9%(-0.668)#476 | 2.1%(-0.925)#18,328 |
| 7. | 65806 | 1.0% | 1.9%(-0.867)#527 | 2.1%(-1.12)#19,844 |
| 8. | 65809 | 0.69% | 1.9%(-1.20)#608 | 2.1%(-1.46)#22,147 |
1
Common Questions
What are the Top 5 Zip Codes with the Highest Percentage of Population Employed in Security & Protection in Springfield, MO?
Top 5 Zip Codes with the Highest Percentage of Population Employed in Security & Protection in Springfield, MO are:
What zip code has the Highest Percentage of Population Employed in Security & Protection in Springfield, MO?
65897 has the Highest Percentage of Population Employed in Security & Protection in Springfield, MO with 2.6%.
What is the Percentage of Population Employed in Security & Protection in Springfield, MO?
Percentage of Population Employed in Security & Protection in Springfield is 1.5%.
What is the Percentage of Population Employed in Security & Protection in Missouri?
Percentage of Population Employed in Security & Protection in Missouri is 1.9%.
What is the Percentage of Population Employed in Security & Protection in the United States?
Percentage of Population Employed in Security & Protection in the United States is 2.1%.