Zip Codes with the Highest Percentage of Population Employed in Security & Protection in Saint Joseph, MO
RELATED REPORTS & OPTIONS
Security & Protection
Saint Joseph
Compare Zip Codes
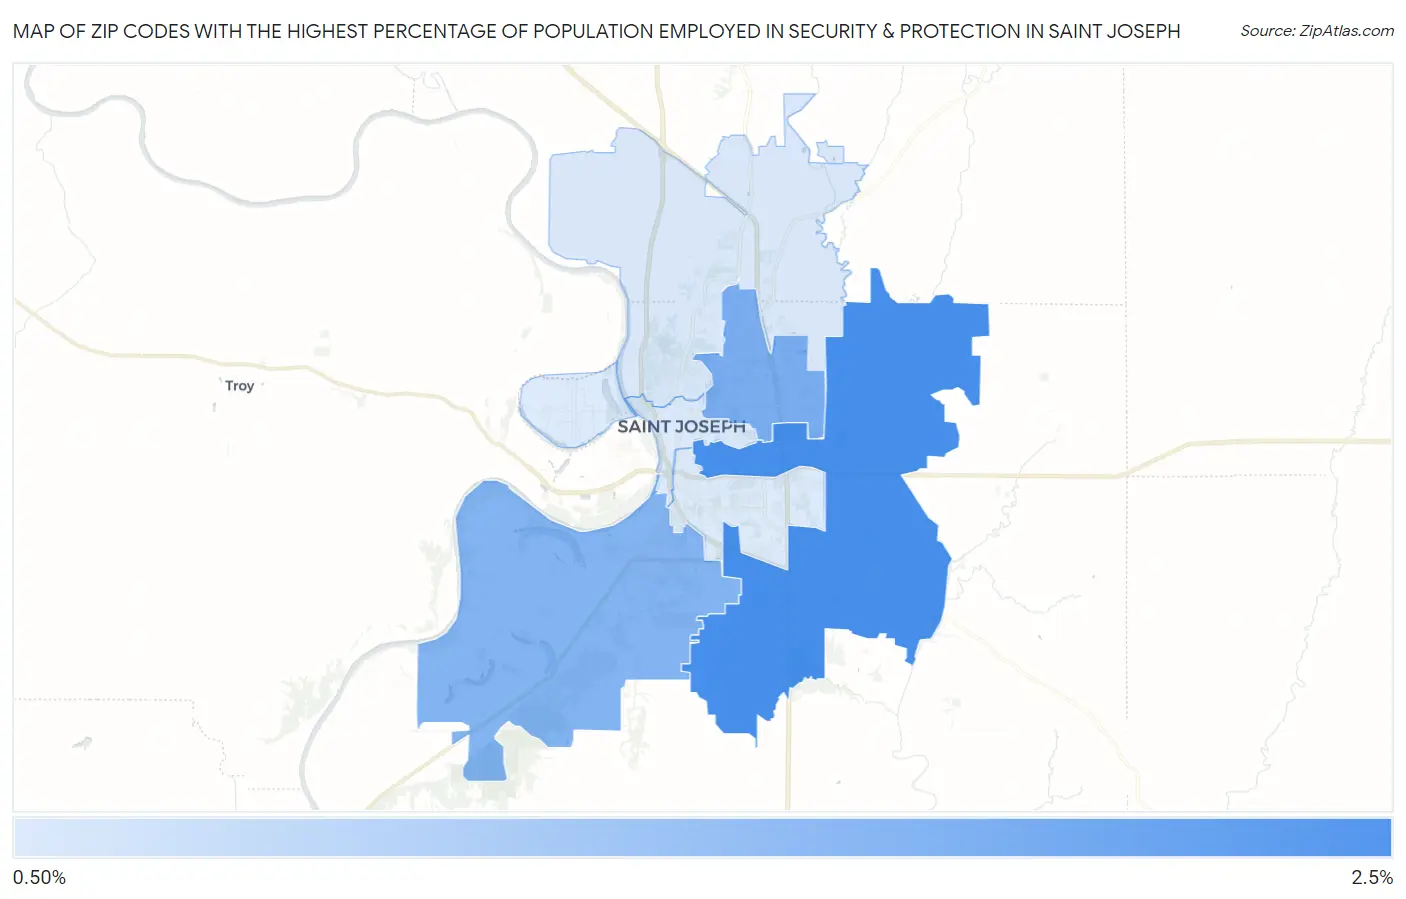
Map of Zip Codes with the Highest Percentage of Population Employed in Security & Protection in Saint Joseph
1.2%
2.4%
Zip Codes with the Highest Percentage of Population Employed in Security & Protection in Saint Joseph, MO
| Zip Code | % Employed | vs State | vs National | |
| 1. | 64507 | 2.4% | 1.9%(+0.533)#230 | 2.1%(+0.276)#9,934 |
| 2. | 64506 | 2.0% | 1.9%(+0.122)#300 | 2.1%(-0.135)#12,476 |
| 3. | 64504 | 1.9% | 1.9%(+0.047)#311 | 2.1%(-0.210)#12,964 |
| 4. | 64505 | 1.2% | 1.9%(-0.656)#474 | 2.1%(-0.913)#18,237 |
| 5. | 64501 | 1.2% | 1.9%(-0.695)#482 | 2.1%(-0.953)#18,535 |
| 6. | 64503 | 1.2% | 1.9%(-0.698)#483 | 2.1%(-0.956)#18,560 |
1
Common Questions
What are the Top 5 Zip Codes with the Highest Percentage of Population Employed in Security & Protection in Saint Joseph, MO?
Top 5 Zip Codes with the Highest Percentage of Population Employed in Security & Protection in Saint Joseph, MO are:
What zip code has the Highest Percentage of Population Employed in Security & Protection in Saint Joseph, MO?
64507 has the Highest Percentage of Population Employed in Security & Protection in Saint Joseph, MO with 2.4%.
What is the Percentage of Population Employed in Security & Protection in Missouri?
Percentage of Population Employed in Security & Protection in Missouri is 1.9%.
What is the Percentage of Population Employed in Security & Protection in the United States?
Percentage of Population Employed in Security & Protection in the United States is 2.1%.