Zip Codes with the Highest Percentage of Population with a Degree in Computers and Mathematics in Kansas City, MO

RELATED REPORTS & OPTIONS

Computers and Mathematics
Population
Families and Households
Female Fertility
Female Fertility (Unmarried)
Race (Community Size)
Race (Percentage)
Ancestry (Community Size)
AfghanAfricanAlaska NativeAlbanianAmericanApacheArabArgentineanArmenianAustralianAustrianBahamianBangladeshiBelgianBelizeanBhutaneseBlackfeetBolivianBrazilianBritishBulgarianBurmeseCanadianCelticCentral AmericanCentral American IndianCherokeeChickasawChileanChippewaChoctawColombianComancheCosta RicanCreeCreekCroatianCrowCubanCzechCzechoslovakianDanishDominicanDutchDutch West IndianEastern EuropeanEcuadorianEgyptianEnglishEthiopianEuropeanFijianFilipinoFinnishFrenchFrench American IndianFrench CanadianGermanGerman RussianGhanaianGreekGuamanian / ChamorroGuatemalanGuyaneseHaitianHonduranHungarianIcelanderIndian (Asian)IndonesianIranianIraqiIrishIroquoisIsraeliItalianJamaicanJapaneseJordanianKenyanKoreanLaotianLatvianLebaneseLiberianLithuanianLuxembourgerMalaysianMexicanMexican American IndianMongolianMoroccanNative HawaiianNavajoNew ZealanderNicaraguanNigerianNorthern EuropeanNorwegianOsageOttawaPakistaniPalestinianPanamanianPennsylvania GermanPeruvianPolishPortuguesePotawatomiPuebloPuerto RicanRomanianRussianSalvadoranSamoanScandinavianScotch-IrishScottishSeminoleSerbianShoshoneSierra LeoneanSiouxSlavicSlovakSloveneSomaliSouth AfricanSouth AmericanSouth American IndianSpaniardSpanishSri LankanSubsaharan AfricanSudaneseSwedishSwissSyrianThaiTrinidadian and TobagonianTurkishUgandanUkrainianUruguayanVenezuelanVietnameseWelshWest IndianYugoslavian
Ancestry (Percentage)
AfghanAfricanAlaska NativeAlbanianAmericanApacheArabArgentineanArmenianAustralianAustrianBahamianBangladeshiBelgianBelizeanBhutaneseBlackfeetBolivianBrazilianBritishBulgarianBurmeseCanadianCelticCentral AmericanCentral American IndianCherokeeChickasawChileanChippewaChoctawColombianComancheCosta RicanCreeCreekCroatianCrowCubanCzechCzechoslovakianDanishDominicanDutchDutch West IndianEastern EuropeanEcuadorianEgyptianEnglishEthiopianEuropeanFijianFilipinoFinnishFrenchFrench American IndianFrench CanadianGermanGerman RussianGhanaianGreekGuamanian / ChamorroGuatemalanGuyaneseHaitianHonduranHungarianIcelanderIndian (Asian)IndonesianIranianIraqiIrishIroquoisIsraeliItalianJamaicanJapaneseJordanianKenyanKoreanLaotianLatvianLebaneseLiberianLithuanianLuxembourgerMalaysianMexicanMexican American IndianMongolianMoroccanNative HawaiianNavajoNew ZealanderNicaraguanNigerianNorthern EuropeanNorwegianOsageOttawaPakistaniPalestinianPanamanianPennsylvania GermanPeruvianPolishPortuguesePotawatomiPuebloPuerto RicanRomanianRussianSalvadoranSamoanScandinavianScotch-IrishScottishSeminoleSerbianShoshoneSierra LeoneanSiouxSlavicSlovakSloveneSomaliSouth AfricanSouth AmericanSouth American IndianSpaniardSpanishSri LankanSubsaharan AfricanSudaneseSwedishSwissSyrianThaiTrinidadian and TobagonianTurkishUgandanUkrainianUruguayanVenezuelanVietnameseWelshWest IndianYugoslavian
Immigrant Origin (Total)
AfghanistanAfricaArgentinaAsiaAustraliaBahamasBangladeshBelarusBelgiumBelizeBoliviaBosnia and HerzegovinaBrazilBulgariaBurma / MyanmarCambodiaCameroonCanadaCaribbeanCentral AmericaChileChinaColombiaCongoCosta RicaCubaCzechoslovakiaDenmarkDominican RepublicEastern AfricaEastern AsiaEastern EuropeEcuadorEgyptEl SalvadorEnglandEritreaEthiopiaEuropeFijiFranceGermanyGhanaGreeceGuatemalaGuyanaHaitiHondurasHong KongHungaryIndiaIndonesiaIranIraqIrelandIsraelItalyJamaicaJapanJordanKazakhstanKenyaKoreaKuwaitLaosLatin AmericaLebanonLiberiaMalaysiaMexicoMicronesiaMiddle AfricaMoroccoNepalNetherlandsNicaraguaNigeriaNorthern AfricaNorthern EuropeOceaniaPakistanPeruPhilippinesPolandPortugalRomaniaRussiaSaudi ArabiaScotlandSierra LeoneSomaliaSouth AfricaSouth AmericaSouth Central AsiaSouth Eastern AsiaSouthern EuropeSpainSri LankaSudanSwedenSwitzerlandSyriaTaiwanThailandTrinidad and TobagoTurkeyUgandaUkraineUruguayVenezuelaVietnamWestern AfricaWestern AsiaWestern EuropeZaireZimbabwe
Immigrant Origin (Percentage)
AfghanistanAfricaArgentinaAsiaAustraliaBahamasBangladeshBelarusBelgiumBelizeBoliviaBosnia and HerzegovinaBrazilBulgariaBurma / MyanmarCambodiaCameroonCanadaCaribbeanCentral AmericaChileChinaColombiaCongoCosta RicaCubaCzechoslovakiaDenmarkDominican RepublicEastern AfricaEastern AsiaEastern EuropeEcuadorEgyptEl SalvadorEnglandEritreaEthiopiaEuropeFijiFranceGermanyGhanaGreeceGuatemalaGuyanaHaitiHondurasHong KongHungaryIndiaIndonesiaIranIraqIrelandIsraelItalyJamaicaJapanJordanKazakhstanKenyaKoreaKuwaitLaosLatin AmericaLebanonLiberiaMalaysiaMexicoMicronesiaMiddle AfricaMoroccoNepalNetherlandsNicaraguaNigeriaNorthern AfricaNorthern EuropeOceaniaPakistanPeruPhilippinesPolandPortugalRomaniaRussiaSaudi ArabiaScotlandSierra LeoneSomaliaSouth AfricaSouth AmericaSouth Central AsiaSouth Eastern AsiaSouthern EuropeSpainSri LankaSudanSwedenSwitzerlandSyriaTaiwanThailandTrinidad and TobagoTurkeyUgandaUkraineUruguayVenezuelaVietnamWestern AfricaWestern AsiaWestern EuropeZaireZimbabwe
Income
Income (Families)
Income (Households)
Poverty
Poverty (Families)
Unemployment
Employment Occupations
Employment Industries
Employer Class
Commute Time
Commute Means
School Enrollment
Education by Degree Field
Occupancy
Finances
Physical Characteristics
Kansas City
Compare Zip Codes
Comparison Subject

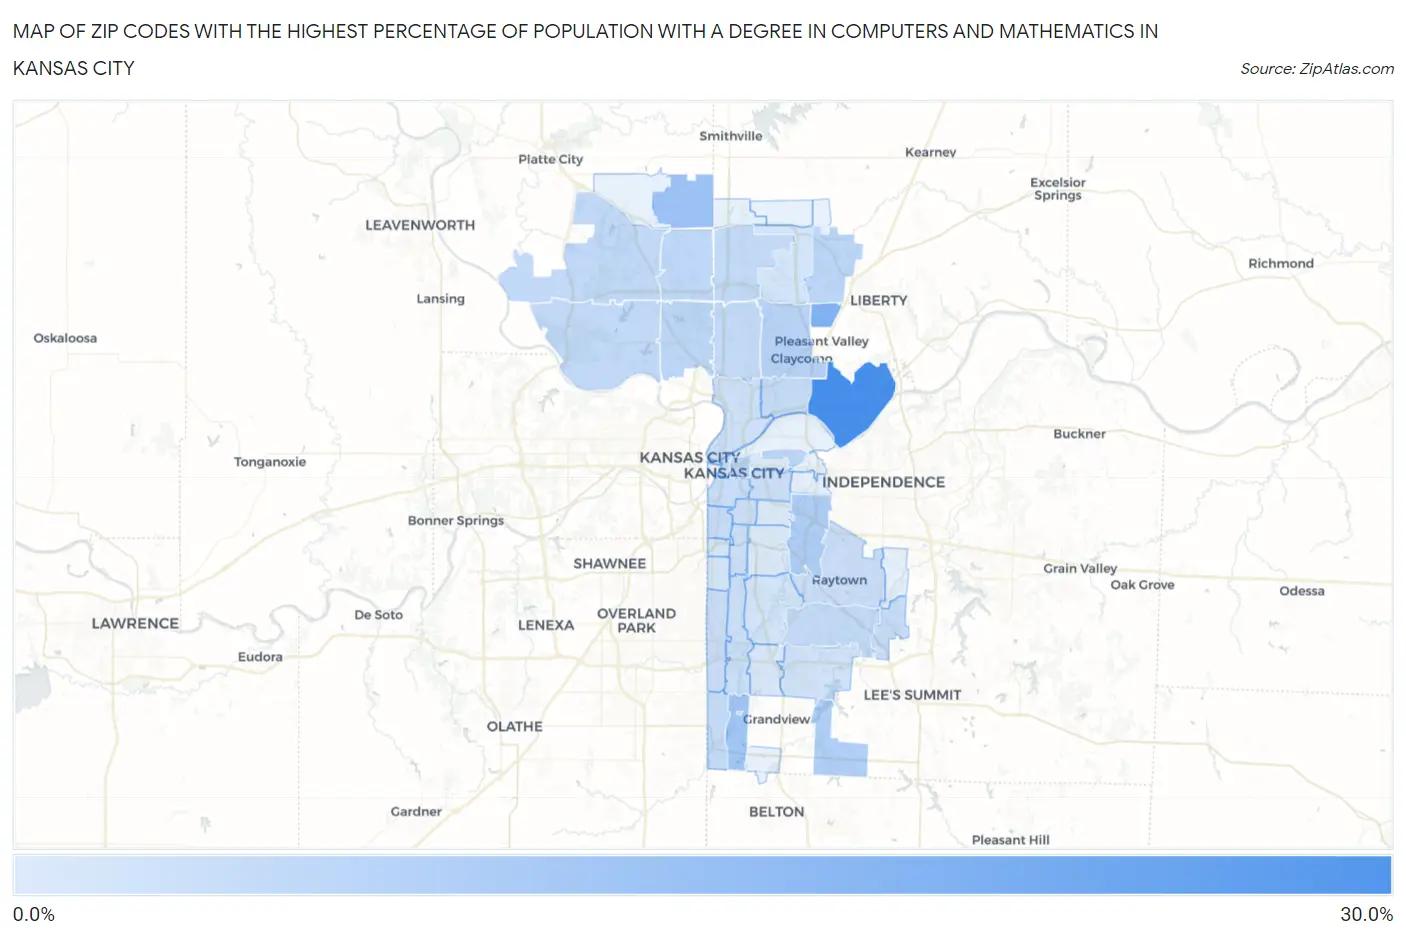
Map of Zip Codes with the Highest Percentage of Population with a Degree in Computers and Mathematics in Kansas City

0.0%
30.0%
Zip Codes with the Highest Percentage of Population with a Degree in Computers and Mathematics in Kansas City Map

Zip Codes with the Highest Percentage of Population with a Degree in Computers and Mathematics in Kansas City, MO

Zip Code % Graduates vs State vs National
1.6416127.0%4.4%(+22.6)#94.9%(+22.1)#265
2.6415816.0%4.4%(+11.6)#294.9%(+11.1)#699
3.6416411.8%4.4%(+7.32)#494.9%(+6.87)#1,273
4.6414610.0%4.4%(+5.52)#614.9%(+5.07)#1,769
5.641298.4%4.4%(+3.93)#714.9%(+3.48)#2,607
6.641497.7%4.4%(+3.25)#874.9%(+2.80)#3,166
7.641196.8%4.4%(+2.39)#1024.9%(+1.94)#4,015
8.641066.2%4.4%(+1.71)#1324.9%(+1.26)#5,014
9.641515.7%4.4%(+1.29)#1474.9%(+0.847)#5,796
10.641575.7%4.4%(+1.27)#1504.9%(+0.819)#5,853
11.641545.6%4.4%(+1.15)#1544.9%(+0.704)#6,066
12.641235.3%4.4%(+0.897)#1704.9%(+0.450)#6,654
13.641525.3%4.4%(+0.861)#1734.9%(+0.414)#6,737
14.641535.0%4.4%(+0.517)#1954.9%(+0.070)#7,530
15.641554.9%4.4%(+0.481)#2004.9%(+0.033)#7,623
16.641384.8%4.4%(+0.366)#2054.9%(-0.082)#7,952
17.641184.8%4.4%(+0.334)#2084.9%(-0.113)#8,046
18.641454.5%4.4%(+0.073)#2274.9%(-0.375)#8,816
19.641174.4%4.4%(-0.056)#2354.9%(-0.504)#9,232
20.641114.3%4.4%(-0.103)#2394.9%(-0.550)#9,377
21.641084.1%4.4%(-0.384)#2584.9%(-0.831)#10,270
22.641393.8%4.4%(-0.606)#2694.9%(-1.05)#11,044
23.641333.6%4.4%(-0.812)#2834.9%(-1.26)#11,768
24.641143.6%4.4%(-0.852)#2844.9%(-1.30)#11,907
25.641093.4%4.4%(-1.10)#3064.9%(-1.54)#12,830
26.641313.3%4.4%(-1.14)#3114.9%(-1.59)#13,005
27.641053.3%4.4%(-1.18)#3204.9%(-1.63)#13,142
28.641103.2%4.4%(-1.21)#3244.9%(-1.66)#13,255
29.641273.1%4.4%(-1.35)#3354.9%(-1.80)#13,743
30.641162.8%4.4%(-1.68)#3694.9%(-2.13)#14,920
31.641342.6%4.4%(-1.83)#3874.9%(-2.28)#15,465
32.641562.3%4.4%(-2.18)#4204.9%(-2.63)#16,732
33.641322.2%4.4%(-2.20)#4224.9%(-2.65)#16,807
34.641131.7%4.4%(-2.76)#4704.9%(-3.20)#18,567
35.641121.6%4.4%(-2.88)#4804.9%(-3.33)#18,948
36.641371.2%4.4%(-3.26)#5114.9%(-3.70)#20,016
37.641280.88%4.4%(-3.57)#5384.9%(-4.02)#20,781
38.641300.75%4.4%(-3.70)#5474.9%(-4.14)#21,041
39.641240.73%4.4%(-3.72)#5504.9%(-4.16)#21,086

Common Questions

What are the Top 10 Zip Codes with the Highest Percentage of Population with a Degree in Computers and Mathematics in Kansas City, MO?
Top 10 Zip Codes with the Highest Percentage of Population with a Degree in Computers and Mathematics in Kansas City, MO are:
#1
27.0%
#2
16.0%
#3
11.8%
#4
10.0%
#5
8.4%
#6
7.7%
#7
6.8%
#8
6.2%
#9
5.7%
#10
5.7%
What zip code has the Highest Percentage of Population with a Degree in Computers and Mathematics in Kansas City, MO?
64161 has the Highest Percentage of Population with a Degree in Computers and Mathematics in Kansas City, MO with 27.0%.
What is the Percentage of Population with a Degree in Computers and Mathematics in Kansas City, MO?
Percentage of Population with a Degree in Computers and Mathematics in Kansas City is 4.2%.
What is the Percentage of Population with a Degree in Computers and Mathematics in Missouri?
Percentage of Population with a Degree in Computers and Mathematics in Missouri is 4.4%.
What is the Percentage of Population with a Degree in Computers and Mathematics in the United States?
Percentage of Population with a Degree in Computers and Mathematics in the United States is 4.9%.