Zip Codes with the Highest Percentage of Households Without a Vehicle in Kansas City, MO
RELATED REPORTS & OPTIONS
Households without a Cars
Kansas City
Compare Zip Codes
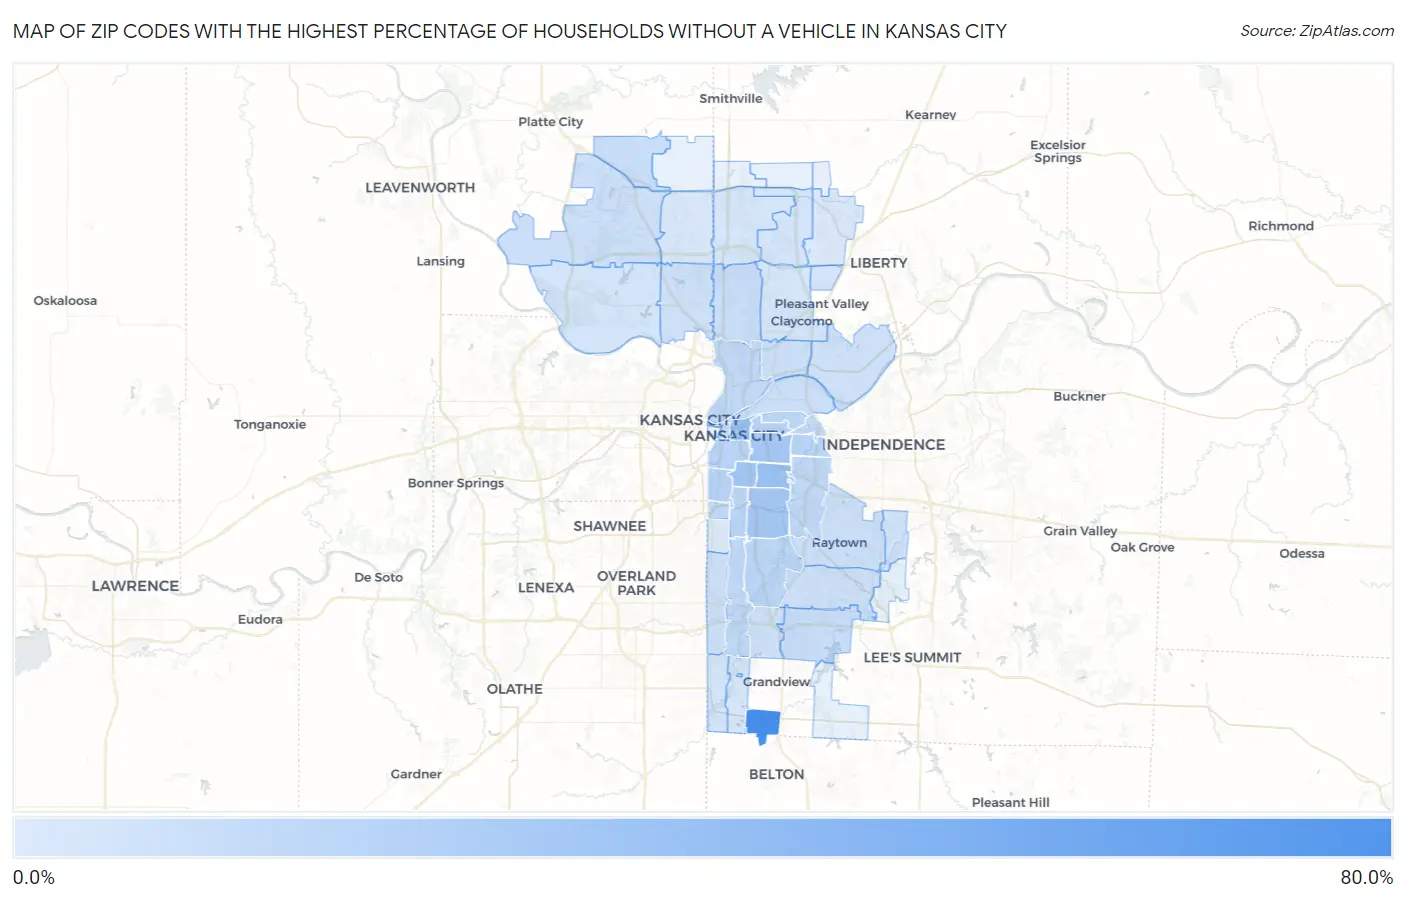
Map of Zip Codes with the Highest Percentage of Households Without a Vehicle in Kansas City
0.30%
64.2%
Zip Codes with the Highest Percentage of Households Without a Vehicle in Kansas City, MO
| Zip Code | Housholds Without a Car | vs State | vs National | |
| 1. | 64147 | 64.2% | 6.6%(+57.6)#3 | 8.3%(+55.9)#241 |
| 2. | 64128 | 24.6% | 6.6%(+18.0)#20 | 8.3%(+16.3)#1,094 |
| 3. | 64106 | 24.4% | 6.6%(+17.8)#21 | 8.3%(+16.1)#1,107 |
| 4. | 64109 | 21.5% | 6.6%(+14.9)#32 | 8.3%(+13.2)#1,341 |
| 5. | 64127 | 20.2% | 6.6%(+13.6)#37 | 8.3%(+11.9)#1,475 |
| 6. | 64130 | 20.0% | 6.6%(+13.4)#38 | 8.3%(+11.7)#1,501 |
| 7. | 64111 | 13.3% | 6.6%(+6.70)#69 | 8.3%(+5.00)#2,971 |
| 8. | 64124 | 12.6% | 6.6%(+6.00)#74 | 8.3%(+4.30)#3,286 |
| 9. | 64126 | 12.5% | 6.6%(+5.90)#77 | 8.3%(+4.20)#3,328 |
| 10. | 64108 | 12.0% | 6.6%(+5.40)#83 | 8.3%(+3.70)#3,567 |
| 11. | 64132 | 11.8% | 6.6%(+5.20)#89 | 8.3%(+3.50)#3,675 |
| 12. | 64110 | 11.6% | 6.6%(+5.00)#90 | 8.3%(+3.30)#3,770 |
| 13. | 64123 | 10.5% | 6.6%(+3.90)#106 | 8.3%(+2.20)#4,472 |
| 14. | 64116 | 10.1% | 6.6%(+3.50)#112 | 8.3%(+1.80)#4,788 |
| 15. | 64129 | 10.1% | 6.6%(+3.50)#113 | 8.3%(+1.80)#4,797 |
| 16. | 64131 | 9.9% | 6.6%(+3.30)#116 | 8.3%(+1.60)#4,942 |
| 17. | 64112 | 9.3% | 6.6%(+2.70)#141 | 8.3%(+1.00)#5,457 |
| 18. | 64125 | 9.2% | 6.6%(+2.60)#145 | 8.3%(+0.900)#5,581 |
| 19. | 64118 | 7.7% | 6.6%(+1.10)#201 | 8.3%(-0.600)#7,358 |
| 20. | 64163 | 7.4% | 6.6%(+0.800)#231 | 8.3%(-0.900)#7,980 |
| 21. | 64134 | 7.3% | 6.6%(+0.700)#235 | 8.3%(-1.00)#8,046 |
| 22. | 64105 | 6.5% | 6.6%(-0.100)#294 | 8.3%(-1.80)#9,459 |
| 23. | 64133 | 5.9% | 6.6%(-0.700)#331 | 8.3%(-2.40)#10,667 |
| 24. | 64117 | 5.8% | 6.6%(-0.800)#340 | 8.3%(-2.50)#10,941 |
| 25. | 64153 | 5.8% | 6.6%(-0.800)#342 | 8.3%(-2.50)#10,979 |
| 26. | 64138 | 5.7% | 6.6%(-0.900)#345 | 8.3%(-2.60)#11,143 |
| 27. | 64120 | 5.4% | 6.6%(-1.20)#376 | 8.3%(-2.90)#12,027 |
| 28. | 64114 | 5.1% | 6.6%(-1.50)#403 | 8.3%(-3.20)#12,623 |
| 29. | 64161 | 5.1% | 6.6%(-1.50)#410 | 8.3%(-3.20)#12,810 |
| 30. | 64151 | 4.8% | 6.6%(-1.80)#426 | 8.3%(-3.50)#13,364 |
| 31. | 64137 | 4.8% | 6.6%(-1.80)#428 | 8.3%(-3.50)#13,438 |
| 32. | 64136 | 4.5% | 6.6%(-2.10)#455 | 8.3%(-3.80)#14,364 |
| 33. | 64158 | 3.6% | 6.6%(-3.00)#544 | 8.3%(-4.70)#17,102 |
| 34. | 64145 | 3.6% | 6.6%(-3.00)#545 | 8.3%(-4.70)#17,118 |
| 35. | 64152 | 3.1% | 6.6%(-3.50)#591 | 8.3%(-5.20)#18,722 |
| 36. | 64156 | 3.0% | 6.6%(-3.60)#605 | 8.3%(-5.30)#19,161 |
| 37. | 64119 | 2.7% | 6.6%(-3.90)#639 | 8.3%(-5.60)#20,091 |
| 38. | 64155 | 2.4% | 6.6%(-4.20)#673 | 8.3%(-5.90)#21,057 |
| 39. | 64154 | 2.0% | 6.6%(-4.60)#716 | 8.3%(-6.30)#22,488 |
| 40. | 64146 | 1.5% | 6.6%(-5.10)#767 | 8.3%(-6.80)#24,296 |
| 41. | 64157 | 1.0% | 6.6%(-5.60)#813 | 8.3%(-7.30)#25,614 |
| 42. | 64113 | 0.30% | 6.6%(-6.30)#843 | 8.3%(-8.00)#27,189 |
1
Common Questions
What are the Top 10 Zip Codes with the Highest Percentage of Households Without a Vehicle in Kansas City, MO?
Top 10 Zip Codes with the Highest Percentage of Households Without a Vehicle in Kansas City, MO are:
What zip code has the Highest Percentage of Households Without a Vehicle in Kansas City, MO?
64147 has the Highest Percentage of Households Without a Vehicle in Kansas City, MO with 64.2%.
What is the Percentage of Households Without a Vehicle in Kansas City, MO?
Percentage of Households Without a Vehicle in Kansas City is 9.1%.
What is the Percentage of Households Without a Vehicle in Missouri?
Percentage of Households Without a Vehicle in Missouri is 6.6%.
What is the Percentage of Households Without a Vehicle in the United States?
Percentage of Households Without a Vehicle in the United States is 8.3%.