Zip Codes with the Highest Percentage of Households Heated by Bottled Gas / Liquid Propane in Kansas City, MO
RELATED REPORTS & OPTIONS
Bottled Gas / LP Heating
Kansas City
Compare Zip Codes
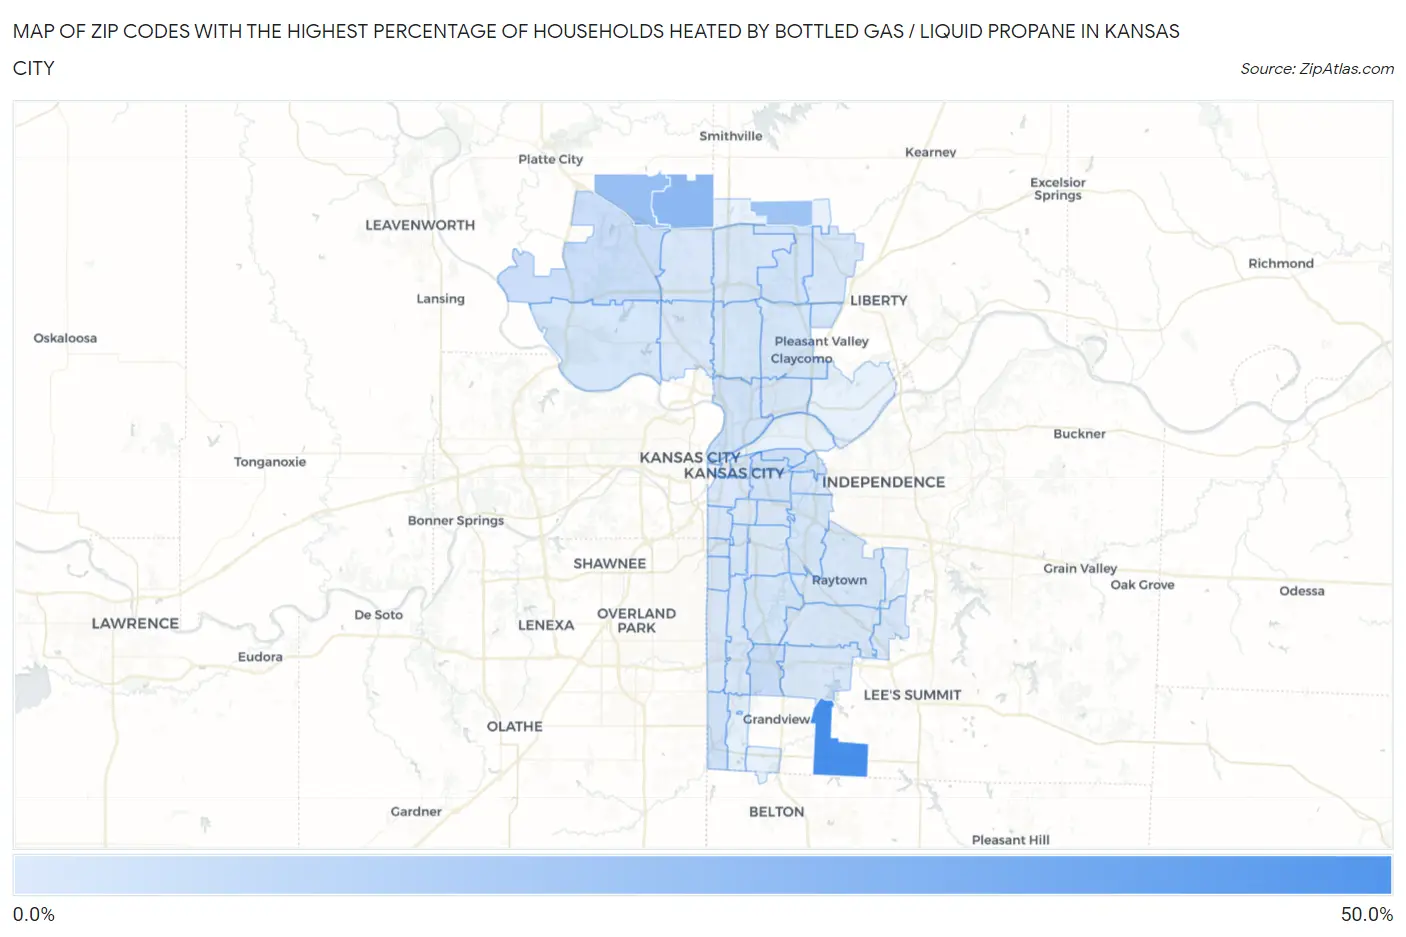
Map of Zip Codes with the Highest Percentage of Households Heated by Bottled Gas / Liquid Propane in Kansas City
0.20%
49.6%
Zip Codes with the Highest Percentage of Households Heated by Bottled Gas / Liquid Propane in Kansas City, MO
| Zip Code | Bottled Gas / LP Heating | vs State | vs National | |
| 1. | 64149 | 49.6% | 8.5%(+41.1)#111 | 4.9%(+44.7)#2,327 |
| 2. | 64164 | 24.0% | 8.5%(+15.5)#457 | 4.9%(+19.1)#7,502 |
| 3. | 64163 | 20.9% | 8.5%(+12.4)#519 | 4.9%(+16.0)#8,622 |
| 4. | 64166 | 18.5% | 8.5%(+10.00)#561 | 4.9%(+13.6)#9,574 |
| 5. | 64137 | 5.3% | 8.5%(-3.20)#805 | 4.9%(+0.400)#18,237 |
| 6. | 64153 | 5.1% | 8.5%(-3.40)#807 | 4.9%(+0.200)#18,440 |
| 7. | 64125 | 3.6% | 8.5%(-4.90)#834 | 4.9%(-1.30)#20,177 |
| 8. | 64116 | 3.4% | 8.5%(-5.10)#840 | 4.9%(-1.50)#20,391 |
| 9. | 64124 | 3.3% | 8.5%(-5.20)#842 | 4.9%(-1.60)#20,574 |
| 10. | 64156 | 3.3% | 8.5%(-5.20)#843 | 4.9%(-1.60)#20,589 |
| 11. | 64123 | 3.1% | 8.5%(-5.40)#848 | 4.9%(-1.80)#20,910 |
| 12. | 64145 | 3.1% | 8.5%(-5.40)#850 | 4.9%(-1.80)#20,932 |
| 13. | 64127 | 2.7% | 8.5%(-5.80)#857 | 4.9%(-2.20)#21,568 |
| 14. | 64119 | 2.2% | 8.5%(-6.30)#865 | 4.9%(-2.70)#22,623 |
| 15. | 64152 | 2.2% | 8.5%(-6.30)#866 | 4.9%(-2.70)#22,625 |
| 16. | 64129 | 2.1% | 8.5%(-6.40)#871 | 4.9%(-2.80)#23,018 |
| 17. | 64158 | 2.1% | 8.5%(-6.40)#872 | 4.9%(-2.80)#23,024 |
| 18. | 64118 | 1.9% | 8.5%(-6.60)#880 | 4.9%(-3.00)#23,399 |
| 19. | 64132 | 1.9% | 8.5%(-6.60)#883 | 4.9%(-3.00)#23,556 |
| 20. | 64133 | 1.7% | 8.5%(-6.80)#888 | 4.9%(-3.20)#23,995 |
| 21. | 64155 | 1.7% | 8.5%(-6.80)#889 | 4.9%(-3.20)#24,051 |
| 22. | 64117 | 1.7% | 8.5%(-6.80)#890 | 4.9%(-3.20)#24,128 |
| 23. | 64154 | 1.7% | 8.5%(-6.80)#891 | 4.9%(-3.20)#24,138 |
| 24. | 64106 | 1.6% | 8.5%(-6.90)#894 | 4.9%(-3.30)#24,496 |
| 25. | 64157 | 1.5% | 8.5%(-7.00)#900 | 4.9%(-3.40)#24,787 |
| 26. | 64113 | 1.5% | 8.5%(-7.00)#902 | 4.9%(-3.40)#24,850 |
| 27. | 64138 | 1.4% | 8.5%(-7.10)#906 | 4.9%(-3.50)#25,137 |
| 28. | 64112 | 1.4% | 8.5%(-7.10)#911 | 4.9%(-3.50)#25,259 |
| 29. | 64134 | 1.2% | 8.5%(-7.30)#923 | 4.9%(-3.70)#25,933 |
| 30. | 64110 | 1.2% | 8.5%(-7.30)#924 | 4.9%(-3.70)#25,976 |
| 31. | 64111 | 1.2% | 8.5%(-7.30)#925 | 4.9%(-3.70)#25,979 |
| 32. | 64139 | 1.1% | 8.5%(-7.40)#930 | 4.9%(-3.80)#26,473 |
| 33. | 64128 | 1.0% | 8.5%(-7.50)#936 | 4.9%(-3.90)#26,829 |
| 34. | 64126 | 1.0% | 8.5%(-7.50)#939 | 4.9%(-3.90)#26,863 |
| 35. | 64151 | 0.90% | 8.5%(-7.60)#941 | 4.9%(-4.00)#27,103 |
| 36. | 64114 | 0.90% | 8.5%(-7.60)#942 | 4.9%(-4.00)#27,132 |
| 37. | 64131 | 0.90% | 8.5%(-7.60)#943 | 4.9%(-4.00)#27,159 |
| 38. | 64108 | 0.70% | 8.5%(-7.80)#951 | 4.9%(-4.20)#28,031 |
| 39. | 64130 | 0.30% | 8.5%(-8.20)#969 | 4.9%(-4.60)#29,209 |
| 40. | 64109 | 0.20% | 8.5%(-8.30)#971 | 4.9%(-4.70)#29,471 |
1
Common Questions
What are the Top 10 Zip Codes with the Highest Percentage of Households Heated by Bottled Gas / Liquid Propane in Kansas City, MO?
Top 10 Zip Codes with the Highest Percentage of Households Heated by Bottled Gas / Liquid Propane in Kansas City, MO are:
What zip code has the Highest Percentage of Households Heated by Bottled Gas / Liquid Propane in Kansas City, MO?
64149 has the Highest Percentage of Households Heated by Bottled Gas / Liquid Propane in Kansas City, MO with 49.6%.
What is the Percentage of Households Heated by Bottled Gas / Liquid Propane in Kansas City, MO?
Percentage of Households Heated by Bottled Gas / Liquid Propane in Kansas City is 1.7%.
What is the Percentage of Households Heated by Bottled Gas / Liquid Propane in Missouri?
Percentage of Households Heated by Bottled Gas / Liquid Propane in Missouri is 8.5%.
What is the Percentage of Households Heated by Bottled Gas / Liquid Propane in the United States?
Percentage of Households Heated by Bottled Gas / Liquid Propane in the United States is 4.9%.