Zip Codes with the Highest Percentage of Population with a Degree in Literature and Languages in Kansas City, MO

RELATED REPORTS & OPTIONS

Literature and Languages
Population
Families and Households
Female Fertility
Female Fertility (Unmarried)
Race (Community Size)
Race (Percentage)
Ancestry (Community Size)
AfghanAfricanAlaska NativeAlbanianAmericanApacheArabArgentineanArmenianAustralianAustrianBahamianBangladeshiBelgianBelizeanBhutaneseBlackfeetBolivianBrazilianBritishBulgarianBurmeseCanadianCelticCentral AmericanCentral American IndianCherokeeChickasawChileanChippewaChoctawColombianComancheCosta RicanCreeCreekCroatianCrowCubanCzechCzechoslovakianDanishDominicanDutchDutch West IndianEastern EuropeanEcuadorianEgyptianEnglishEthiopianEuropeanFijianFilipinoFinnishFrenchFrench American IndianFrench CanadianGermanGerman RussianGhanaianGreekGuamanian / ChamorroGuatemalanGuyaneseHaitianHonduranHungarianIcelanderIndian (Asian)IndonesianIranianIraqiIrishIroquoisIsraeliItalianJamaicanJapaneseJordanianKenyanKoreanLaotianLatvianLebaneseLiberianLithuanianLuxembourgerMalaysianMexicanMexican American IndianMongolianMoroccanNative HawaiianNavajoNew ZealanderNicaraguanNigerianNorthern EuropeanNorwegianOsageOttawaPakistaniPalestinianPanamanianPennsylvania GermanPeruvianPolishPortuguesePotawatomiPuebloPuerto RicanRomanianRussianSalvadoranSamoanScandinavianScotch-IrishScottishSeminoleSerbianShoshoneSierra LeoneanSiouxSlavicSlovakSloveneSomaliSouth AfricanSouth AmericanSouth American IndianSpaniardSpanishSri LankanSubsaharan AfricanSudaneseSwedishSwissSyrianThaiTrinidadian and TobagonianTurkishUgandanUkrainianUruguayanVenezuelanVietnameseWelshWest IndianYugoslavian
Ancestry (Percentage)
AfghanAfricanAlaska NativeAlbanianAmericanApacheArabArgentineanArmenianAustralianAustrianBahamianBangladeshiBelgianBelizeanBhutaneseBlackfeetBolivianBrazilianBritishBulgarianBurmeseCanadianCelticCentral AmericanCentral American IndianCherokeeChickasawChileanChippewaChoctawColombianComancheCosta RicanCreeCreekCroatianCrowCubanCzechCzechoslovakianDanishDominicanDutchDutch West IndianEastern EuropeanEcuadorianEgyptianEnglishEthiopianEuropeanFijianFilipinoFinnishFrenchFrench American IndianFrench CanadianGermanGerman RussianGhanaianGreekGuamanian / ChamorroGuatemalanGuyaneseHaitianHonduranHungarianIcelanderIndian (Asian)IndonesianIranianIraqiIrishIroquoisIsraeliItalianJamaicanJapaneseJordanianKenyanKoreanLaotianLatvianLebaneseLiberianLithuanianLuxembourgerMalaysianMexicanMexican American IndianMongolianMoroccanNative HawaiianNavajoNew ZealanderNicaraguanNigerianNorthern EuropeanNorwegianOsageOttawaPakistaniPalestinianPanamanianPennsylvania GermanPeruvianPolishPortuguesePotawatomiPuebloPuerto RicanRomanianRussianSalvadoranSamoanScandinavianScotch-IrishScottishSeminoleSerbianShoshoneSierra LeoneanSiouxSlavicSlovakSloveneSomaliSouth AfricanSouth AmericanSouth American IndianSpaniardSpanishSri LankanSubsaharan AfricanSudaneseSwedishSwissSyrianThaiTrinidadian and TobagonianTurkishUgandanUkrainianUruguayanVenezuelanVietnameseWelshWest IndianYugoslavian
Immigrant Origin (Total)
AfghanistanAfricaArgentinaAsiaAustraliaBahamasBangladeshBelarusBelgiumBelizeBoliviaBosnia and HerzegovinaBrazilBulgariaBurma / MyanmarCambodiaCameroonCanadaCaribbeanCentral AmericaChileChinaColombiaCongoCosta RicaCubaCzechoslovakiaDenmarkDominican RepublicEastern AfricaEastern AsiaEastern EuropeEcuadorEgyptEl SalvadorEnglandEritreaEthiopiaEuropeFijiFranceGermanyGhanaGreeceGuatemalaGuyanaHaitiHondurasHong KongHungaryIndiaIndonesiaIranIraqIrelandIsraelItalyJamaicaJapanJordanKazakhstanKenyaKoreaKuwaitLaosLatin AmericaLebanonLiberiaMalaysiaMexicoMicronesiaMiddle AfricaMoroccoNepalNetherlandsNicaraguaNigeriaNorthern AfricaNorthern EuropeOceaniaPakistanPeruPhilippinesPolandPortugalRomaniaRussiaSaudi ArabiaScotlandSierra LeoneSomaliaSouth AfricaSouth AmericaSouth Central AsiaSouth Eastern AsiaSouthern EuropeSpainSri LankaSudanSwedenSwitzerlandSyriaTaiwanThailandTrinidad and TobagoTurkeyUgandaUkraineUruguayVenezuelaVietnamWestern AfricaWestern AsiaWestern EuropeZaireZimbabwe
Immigrant Origin (Percentage)
AfghanistanAfricaArgentinaAsiaAustraliaBahamasBangladeshBelarusBelgiumBelizeBoliviaBosnia and HerzegovinaBrazilBulgariaBurma / MyanmarCambodiaCameroonCanadaCaribbeanCentral AmericaChileChinaColombiaCongoCosta RicaCubaCzechoslovakiaDenmarkDominican RepublicEastern AfricaEastern AsiaEastern EuropeEcuadorEgyptEl SalvadorEnglandEritreaEthiopiaEuropeFijiFranceGermanyGhanaGreeceGuatemalaGuyanaHaitiHondurasHong KongHungaryIndiaIndonesiaIranIraqIrelandIsraelItalyJamaicaJapanJordanKazakhstanKenyaKoreaKuwaitLaosLatin AmericaLebanonLiberiaMalaysiaMexicoMicronesiaMiddle AfricaMoroccoNepalNetherlandsNicaraguaNigeriaNorthern AfricaNorthern EuropeOceaniaPakistanPeruPhilippinesPolandPortugalRomaniaRussiaSaudi ArabiaScotlandSierra LeoneSomaliaSouth AfricaSouth AmericaSouth Central AsiaSouth Eastern AsiaSouthern EuropeSpainSri LankaSudanSwedenSwitzerlandSyriaTaiwanThailandTrinidad and TobagoTurkeyUgandaUkraineUruguayVenezuelaVietnamWestern AfricaWestern AsiaWestern EuropeZaireZimbabwe
Income
Income (Families)
Income (Households)
Poverty
Poverty (Families)
Unemployment
Employment Occupations
Employment Industries
Employer Class
Commute Time
Commute Means
School Enrollment
Education by Degree Field
Occupancy
Finances
Physical Characteristics
Kansas City
Compare Zip Codes
Comparison Subject

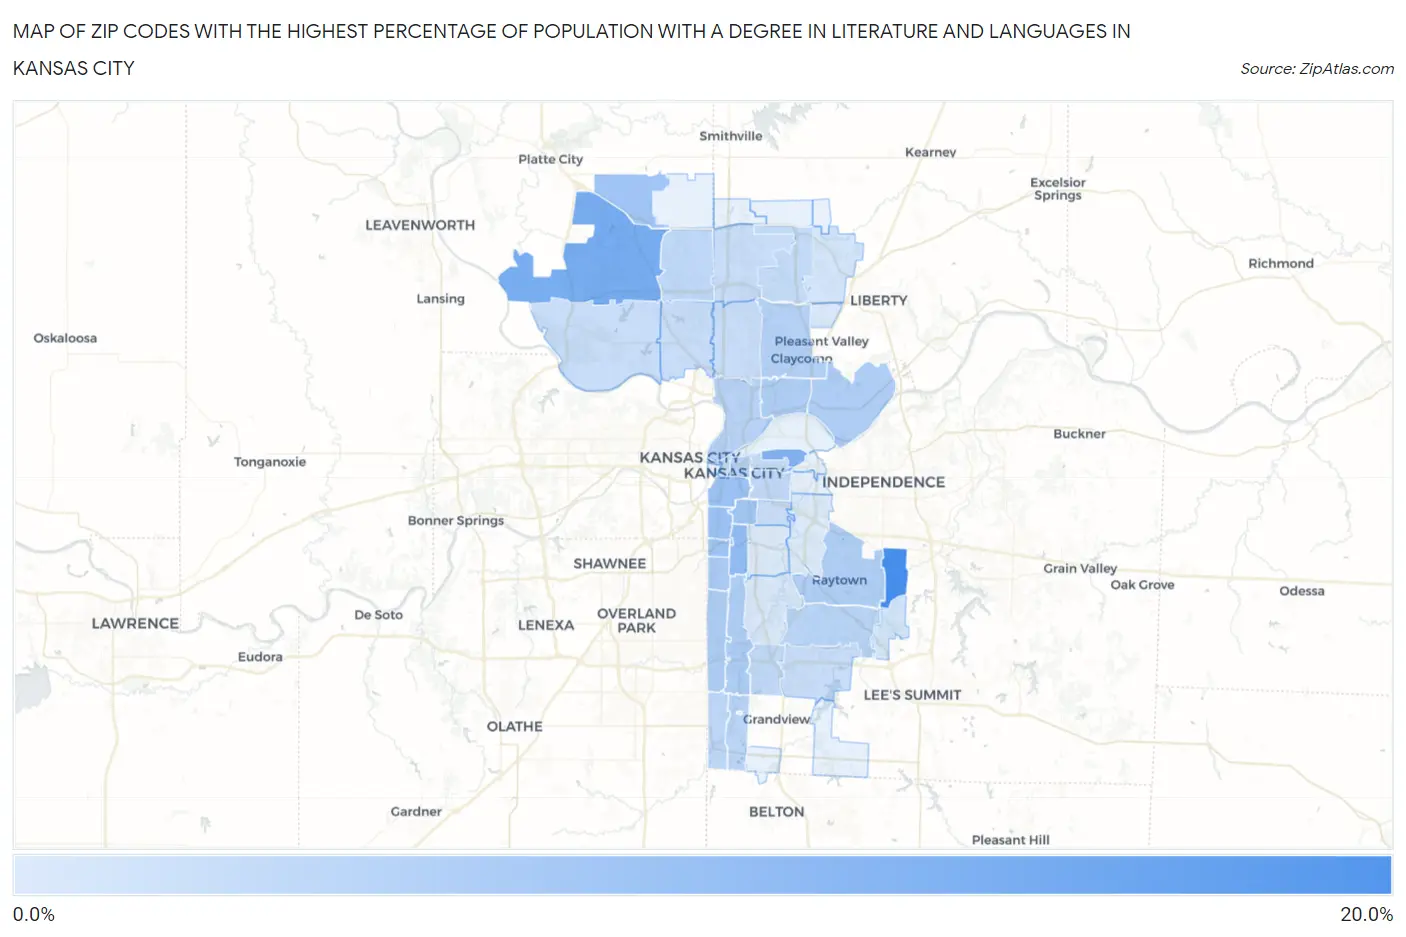
Map of Zip Codes with the Highest Percentage of Population with a Degree in Literature and Languages in Kansas City

0.0%
20.0%
Zip Codes with the Highest Percentage of Population with a Degree in Literature and Languages in Kansas City Map

Zip Codes with the Highest Percentage of Population with a Degree in Literature and Languages in Kansas City, MO

Zip Code % Graduates vs State vs National
1.6413615.0%3.4%(+11.6)#244.4%(+10.6)#810
2.6415310.4%3.4%(+6.96)#414.4%(+5.96)#1,688
3.641239.4%3.4%(+5.98)#454.4%(+4.98)#2,095
4.641107.9%3.4%(+4.50)#604.4%(+3.50)#3,060
5.641087.2%3.4%(+3.78)#784.4%(+2.78)#3,769
6.641117.1%3.4%(+3.70)#804.4%(+2.70)#3,859
7.641126.6%3.4%(+3.20)#844.4%(+2.20)#4,480
8.641636.6%3.4%(+3.18)#854.4%(+2.18)#4,507
9.641096.3%3.4%(+2.92)#944.4%(+1.92)#4,890
10.641135.5%3.4%(+2.13)#1174.4%(+1.13)#6,247
11.641615.4%3.4%(+2.00)#1244.4%(+0.996)#6,507
12.641315.4%3.4%(+1.99)#1264.4%(+0.988)#6,520
13.641175.4%3.4%(+1.98)#1284.4%(+0.985)#6,528
14.641145.2%3.4%(+1.82)#1324.4%(+0.816)#6,891
15.641335.0%3.4%(+1.60)#1384.4%(+0.605)#7,319
16.641194.7%3.4%(+1.26)#1504.4%(+0.257)#8,242
17.641164.5%3.4%(+1.11)#1544.4%(+0.109)#8,669
18.641064.5%3.4%(+1.10)#1554.4%(+0.100)#8,697
19.641384.4%3.4%(+0.967)#1614.4%(-0.033)#9,070
20.641464.2%3.4%(+0.770)#1684.4%(-0.230)#9,665
21.641544.0%3.4%(+0.576)#1734.4%(-0.423)#10,207
22.641453.9%3.4%(+0.446)#1814.4%(-0.554)#10,657
23.641373.8%3.4%(+0.362)#1854.4%(-0.637)#10,921
24.641273.6%3.4%(+0.202)#1944.4%(-0.798)#11,445
25.641563.5%3.4%(+0.127)#1994.4%(-0.872)#11,726
26.641243.2%3.4%(-0.194)#2224.4%(-1.19)#12,846
27.641553.2%3.4%(-0.260)#2274.4%(-1.26)#13,057
28.641183.1%3.4%(-0.355)#2344.4%(-1.35)#13,386
29.641343.0%3.4%(-0.402)#2374.4%(-1.40)#13,540
30.641523.0%3.4%(-0.408)#2394.4%(-1.41)#13,568
31.641053.0%3.4%(-0.415)#2424.4%(-1.41)#13,593
32.641513.0%3.4%(-0.430)#2464.4%(-1.43)#13,651
33.641282.9%3.4%(-0.524)#2494.4%(-1.52)#13,947
34.641572.1%3.4%(-1.28)#3174.4%(-2.28)#16,640
35.641392.0%3.4%(-1.42)#3314.4%(-2.42)#17,127
36.641321.7%3.4%(-1.70)#3604.4%(-2.69)#17,971
37.641581.6%3.4%(-1.80)#3704.4%(-2.80)#18,308
38.641301.3%3.4%(-2.10)#4094.4%(-3.10)#19,250
39.641291.3%3.4%(-2.13)#4124.4%(-3.13)#19,361

Common Questions

What are the Top 10 Zip Codes with the Highest Percentage of Population with a Degree in Literature and Languages in Kansas City, MO?
Top 10 Zip Codes with the Highest Percentage of Population with a Degree in Literature and Languages in Kansas City, MO are:
#1
15.0%
#2
10.4%
#3
9.4%
#4
7.9%
#5
7.2%
#6
7.1%
#7
6.6%
#8
6.6%
#9
6.3%
#10
5.5%
What zip code has the Highest Percentage of Population with a Degree in Literature and Languages in Kansas City, MO?
64136 has the Highest Percentage of Population with a Degree in Literature and Languages in Kansas City, MO with 15.0%.
What is the Percentage of Population with a Degree in Literature and Languages in Kansas City, MO?
Percentage of Population with a Degree in Literature and Languages in Kansas City is 4.7%.
What is the Percentage of Population with a Degree in Literature and Languages in Missouri?
Percentage of Population with a Degree in Literature and Languages in Missouri is 3.4%.
What is the Percentage of Population with a Degree in Literature and Languages in the United States?
Percentage of Population with a Degree in Literature and Languages in the United States is 4.4%.