Zip Codes with the Highest Percentage of Population Employed in Security & Protection in Florissant, MO
RELATED REPORTS & OPTIONS
Security & Protection
Florissant
Compare Zip Codes
Map of Zip Codes with the Highest Percentage of Population Employed in Security & Protection in Florissant
1.4%
2.5%
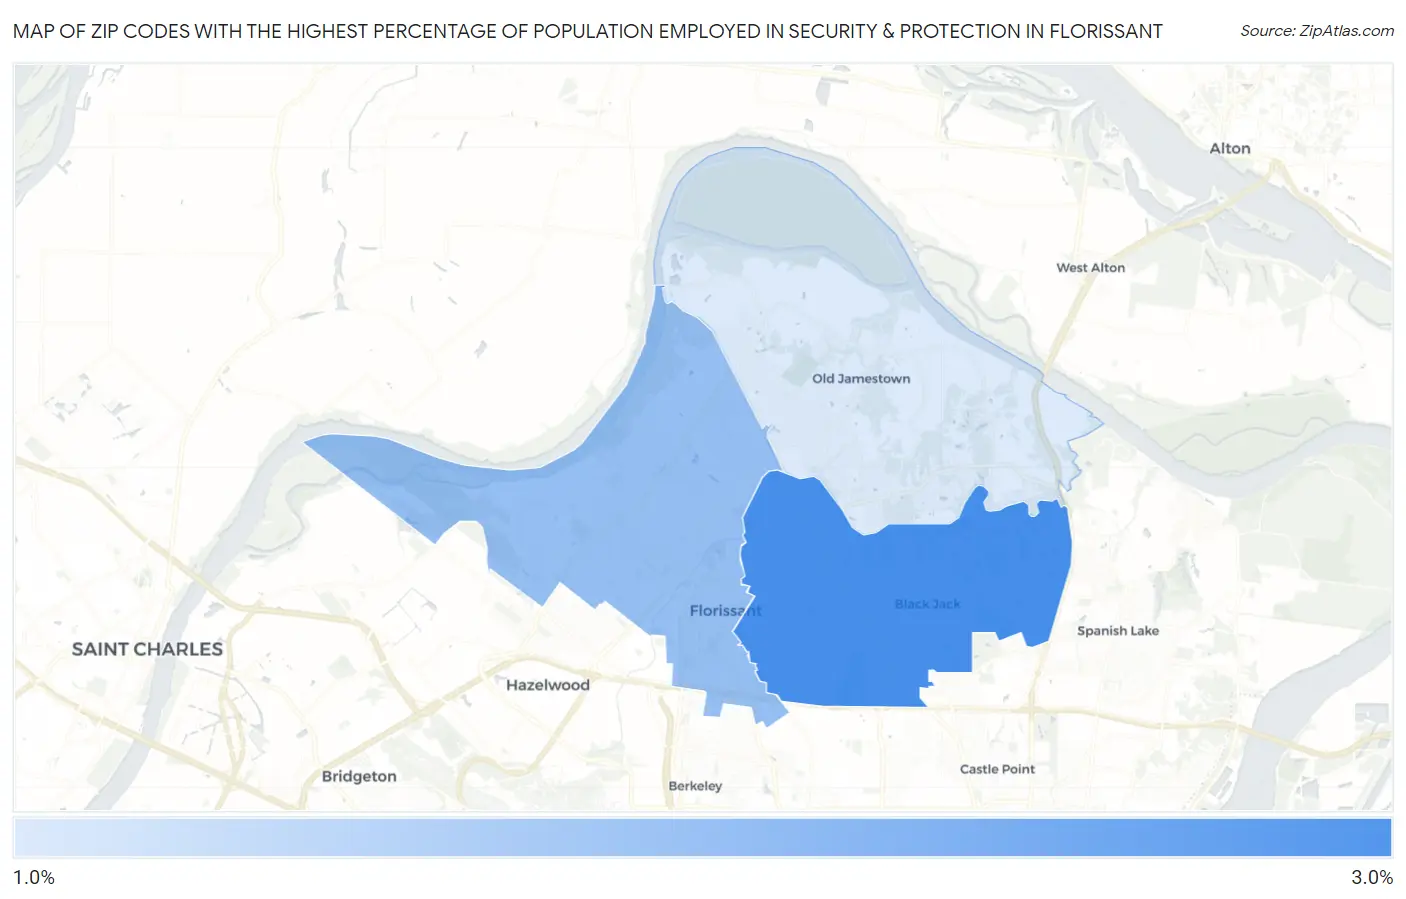
Zip Codes with the Highest Percentage of Population Employed in Security & Protection in Florissant, MO
| Zip Code | % Employed | vs State | vs National | |
| 1. | 63033 | 2.5% | 1.9%(+0.615)#220 | 2.1%(+0.358)#9,478 |
| 2. | 63031 | 1.9% | 1.9%(+0.053)#309 | 2.1%(-0.204)#12,923 |
| 3. | 63034 | 1.4% | 1.9%(-0.449)#425 | 2.1%(-0.706)#16,649 |
1
Common Questions
What are the Top Zip Codes with the Highest Percentage of Population Employed in Security & Protection in Florissant, MO?
Top Zip Codes with the Highest Percentage of Population Employed in Security & Protection in Florissant, MO are:
What zip code has the Highest Percentage of Population Employed in Security & Protection in Florissant, MO?
63033 has the Highest Percentage of Population Employed in Security & Protection in Florissant, MO with 2.5%.
What is the Percentage of Population Employed in Security & Protection in Florissant, MO?
Percentage of Population Employed in Security & Protection in Florissant is 1.6%.
What is the Percentage of Population Employed in Security & Protection in Missouri?
Percentage of Population Employed in Security & Protection in Missouri is 1.9%.
What is the Percentage of Population Employed in Security & Protection in the United States?
Percentage of Population Employed in Security & Protection in the United States is 2.1%.