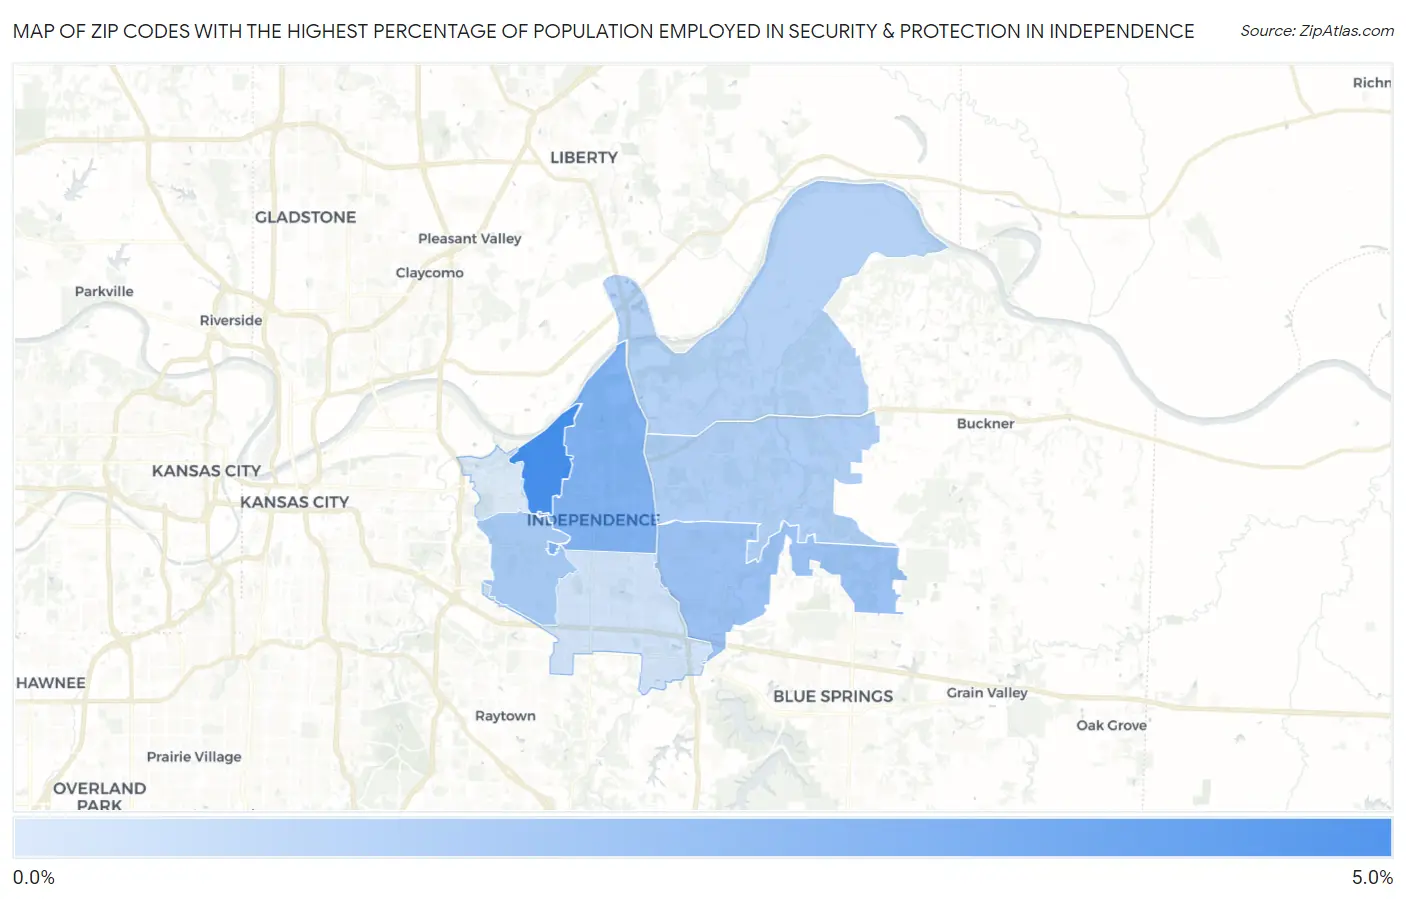
Zip Codes with the Highest Percentage of Population Employed in Security & Protection in Independence, MO
RELATED REPORTS & OPTIONS
Security & Protection
Independence
Compare Zip Codes
Map of Zip Codes with the Highest Percentage of Population Employed in Security & Protection in Independence
0.99%
4.1%
Zip Codes with the Highest Percentage of Population Employed in Security & Protection in Independence, MO
| Zip Code | % Employed | vs State | vs National | |
| 1. | 64054 | 4.1% | 1.9%(+2.20)#88 | 2.1%(+1.94)#4,314 |
| 2. | 64050 | 2.9% | 1.9%(+0.991)#171 | 2.1%(+0.734)#7,718 |
| 3. | 64057 | 2.3% | 1.9%(+0.407)#249 | 2.1%(+0.150)#10,658 |
| 4. | 64052 | 2.1% | 1.9%(+0.207)#284 | 2.1%(-0.050)#11,920 |
| 5. | 64056 | 1.9% | 1.9%(+0.009)#322 | 2.1%(-0.249)#13,223 |
| 6. | 64058 | 1.8% | 1.9%(-0.086)#348 | 2.1%(-0.343)#13,901 |
| 7. | 64055 | 1.2% | 1.9%(-0.662)#475 | 2.1%(-0.920)#18,288 |
| 8. | 64053 | 0.99% | 1.9%(-0.899)#542 | 2.1%(-1.16)#20,100 |
1
Common Questions
What are the Top 5 Zip Codes with the Highest Percentage of Population Employed in Security & Protection in Independence, MO?
Top 5 Zip Codes with the Highest Percentage of Population Employed in Security & Protection in Independence, MO are:
What zip code has the Highest Percentage of Population Employed in Security & Protection in Independence, MO?
64054 has the Highest Percentage of Population Employed in Security & Protection in Independence, MO with 4.1%.
What is the Percentage of Population Employed in Security & Protection in Independence, MO?
Percentage of Population Employed in Security & Protection in Independence is 1.9%.
What is the Percentage of Population Employed in Security & Protection in Missouri?
Percentage of Population Employed in Security & Protection in Missouri is 1.9%.
What is the Percentage of Population Employed in Security & Protection in the United States?
Percentage of Population Employed in Security & Protection in the United States is 2.1%.