Zip Codes with the Highest Percentage of Not-for-profit Organizations in Kansas City, MO

RELATED REPORTS & OPTIONS

Not-for-profit Organizations
Population
Families and Households
Female Fertility
Female Fertility (Unmarried)
Race (Community Size)
Race (Percentage)
Ancestry (Community Size)
AfghanAfricanAlaska NativeAlbanianAmericanApacheArabArgentineanArmenianAustralianAustrianBahamianBangladeshiBelgianBelizeanBhutaneseBlackfeetBolivianBrazilianBritishBulgarianBurmeseCanadianCelticCentral AmericanCentral American IndianCherokeeChickasawChileanChippewaChoctawColombianComancheCosta RicanCreeCreekCroatianCrowCubanCzechCzechoslovakianDanishDominicanDutchDutch West IndianEastern EuropeanEcuadorianEgyptianEnglishEthiopianEuropeanFijianFilipinoFinnishFrenchFrench American IndianFrench CanadianGermanGerman RussianGhanaianGreekGuamanian / ChamorroGuatemalanGuyaneseHaitianHonduranHungarianIcelanderIndian (Asian)IndonesianIranianIraqiIrishIroquoisIsraeliItalianJamaicanJapaneseJordanianKenyanKoreanLaotianLatvianLebaneseLiberianLithuanianLuxembourgerMalaysianMexicanMexican American IndianMongolianMoroccanNative HawaiianNavajoNew ZealanderNicaraguanNigerianNorthern EuropeanNorwegianOsageOttawaPakistaniPalestinianPanamanianPennsylvania GermanPeruvianPolishPortuguesePotawatomiPuebloPuerto RicanRomanianRussianSalvadoranSamoanScandinavianScotch-IrishScottishSeminoleSerbianShoshoneSierra LeoneanSiouxSlavicSlovakSloveneSomaliSouth AfricanSouth AmericanSouth American IndianSpaniardSpanishSri LankanSubsaharan AfricanSudaneseSwedishSwissSyrianThaiTrinidadian and TobagonianTurkishUgandanUkrainianUruguayanVenezuelanVietnameseWelshWest IndianYugoslavian
Ancestry (Percentage)
AfghanAfricanAlaska NativeAlbanianAmericanApacheArabArgentineanArmenianAustralianAustrianBahamianBangladeshiBelgianBelizeanBhutaneseBlackfeetBolivianBrazilianBritishBulgarianBurmeseCanadianCelticCentral AmericanCentral American IndianCherokeeChickasawChileanChippewaChoctawColombianComancheCosta RicanCreeCreekCroatianCrowCubanCzechCzechoslovakianDanishDominicanDutchDutch West IndianEastern EuropeanEcuadorianEgyptianEnglishEthiopianEuropeanFijianFilipinoFinnishFrenchFrench American IndianFrench CanadianGermanGerman RussianGhanaianGreekGuamanian / ChamorroGuatemalanGuyaneseHaitianHonduranHungarianIcelanderIndian (Asian)IndonesianIranianIraqiIrishIroquoisIsraeliItalianJamaicanJapaneseJordanianKenyanKoreanLaotianLatvianLebaneseLiberianLithuanianLuxembourgerMalaysianMexicanMexican American IndianMongolianMoroccanNative HawaiianNavajoNew ZealanderNicaraguanNigerianNorthern EuropeanNorwegianOsageOttawaPakistaniPalestinianPanamanianPennsylvania GermanPeruvianPolishPortuguesePotawatomiPuebloPuerto RicanRomanianRussianSalvadoranSamoanScandinavianScotch-IrishScottishSeminoleSerbianShoshoneSierra LeoneanSiouxSlavicSlovakSloveneSomaliSouth AfricanSouth AmericanSouth American IndianSpaniardSpanishSri LankanSubsaharan AfricanSudaneseSwedishSwissSyrianThaiTrinidadian and TobagonianTurkishUgandanUkrainianUruguayanVenezuelanVietnameseWelshWest IndianYugoslavian
Immigrant Origin (Total)
AfghanistanAfricaArgentinaAsiaAustraliaBahamasBangladeshBelarusBelgiumBelizeBoliviaBosnia and HerzegovinaBrazilBulgariaBurma / MyanmarCambodiaCameroonCanadaCaribbeanCentral AmericaChileChinaColombiaCongoCosta RicaCubaCzechoslovakiaDenmarkDominican RepublicEastern AfricaEastern AsiaEastern EuropeEcuadorEgyptEl SalvadorEnglandEritreaEthiopiaEuropeFijiFranceGermanyGhanaGreeceGuatemalaGuyanaHaitiHondurasHong KongHungaryIndiaIndonesiaIranIraqIrelandIsraelItalyJamaicaJapanJordanKazakhstanKenyaKoreaKuwaitLaosLatin AmericaLebanonLiberiaMalaysiaMexicoMicronesiaMiddle AfricaMoroccoNepalNetherlandsNicaraguaNigeriaNorthern AfricaNorthern EuropeOceaniaPakistanPeruPhilippinesPolandPortugalRomaniaRussiaSaudi ArabiaScotlandSierra LeoneSomaliaSouth AfricaSouth AmericaSouth Central AsiaSouth Eastern AsiaSouthern EuropeSpainSri LankaSudanSwedenSwitzerlandSyriaTaiwanThailandTrinidad and TobagoTurkeyUgandaUkraineUruguayVenezuelaVietnamWestern AfricaWestern AsiaWestern EuropeZaireZimbabwe
Immigrant Origin (Percentage)
AfghanistanAfricaArgentinaAsiaAustraliaBahamasBangladeshBelarusBelgiumBelizeBoliviaBosnia and HerzegovinaBrazilBulgariaBurma / MyanmarCambodiaCameroonCanadaCaribbeanCentral AmericaChileChinaColombiaCongoCosta RicaCubaCzechoslovakiaDenmarkDominican RepublicEastern AfricaEastern AsiaEastern EuropeEcuadorEgyptEl SalvadorEnglandEritreaEthiopiaEuropeFijiFranceGermanyGhanaGreeceGuatemalaGuyanaHaitiHondurasHong KongHungaryIndiaIndonesiaIranIraqIrelandIsraelItalyJamaicaJapanJordanKazakhstanKenyaKoreaKuwaitLaosLatin AmericaLebanonLiberiaMalaysiaMexicoMicronesiaMiddle AfricaMoroccoNepalNetherlandsNicaraguaNigeriaNorthern AfricaNorthern EuropeOceaniaPakistanPeruPhilippinesPolandPortugalRomaniaRussiaSaudi ArabiaScotlandSierra LeoneSomaliaSouth AfricaSouth AmericaSouth Central AsiaSouth Eastern AsiaSouthern EuropeSpainSri LankaSudanSwedenSwitzerlandSyriaTaiwanThailandTrinidad and TobagoTurkeyUgandaUkraineUruguayVenezuelaVietnamWestern AfricaWestern AsiaWestern EuropeZaireZimbabwe
Income
Income (Families)
Income (Households)
Poverty
Poverty (Families)
Unemployment
Employment Occupations
Employment Industries
Employer Class
Commute Time
Commute Means
School Enrollment
Education by Degree Field
Occupancy
Finances
Physical Characteristics
Kansas City
Compare Zip Codes
Comparison Subject

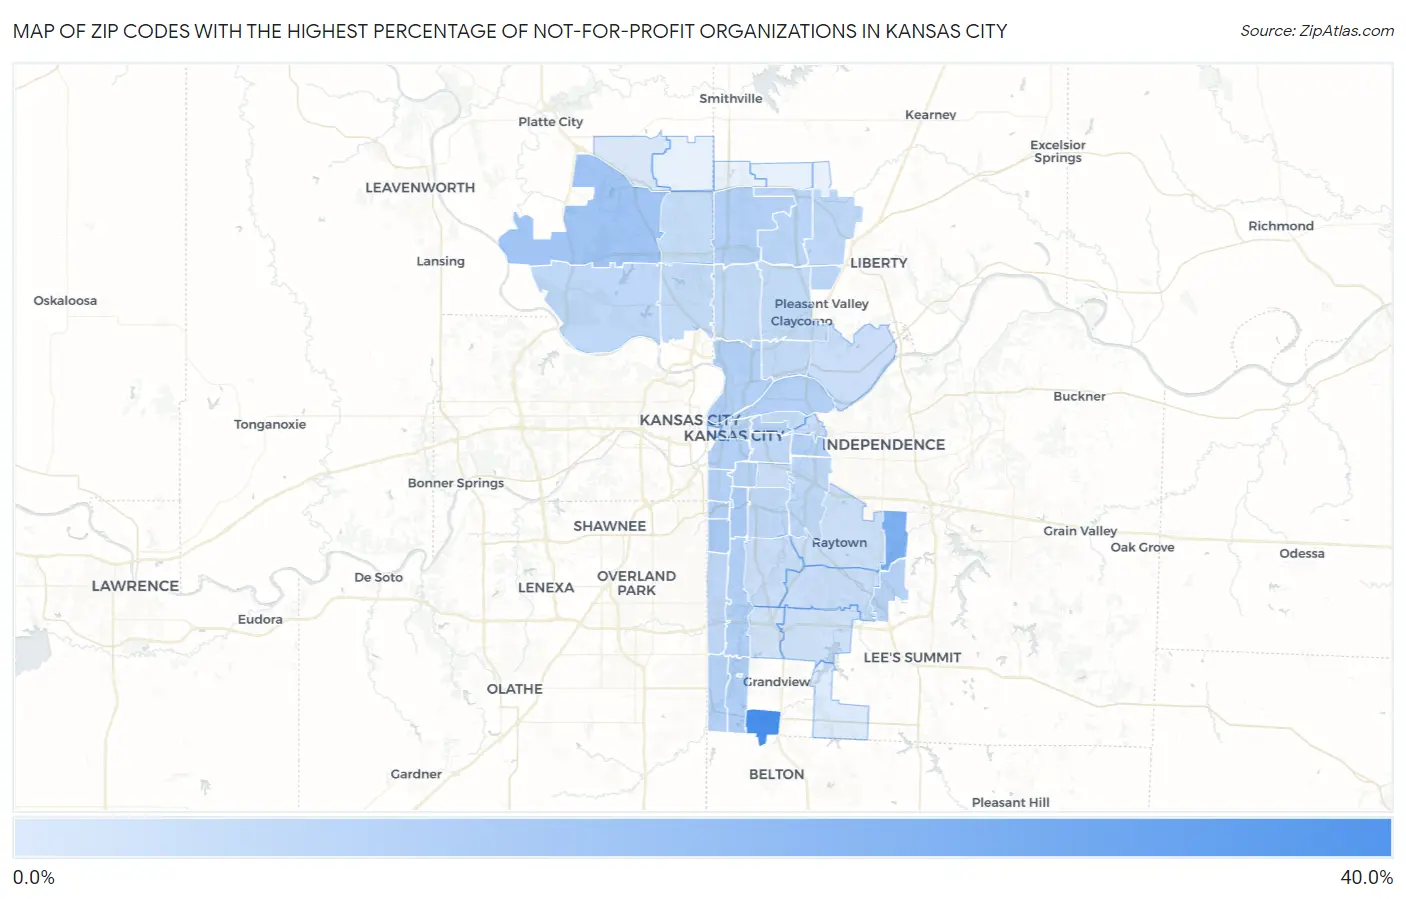
Map of Zip Codes with the Highest Percentage of Not-for-profit Organizations in Kansas City

0.0%
40.0%
Zip Codes with the Highest Percentage of Not-for-profit Organizations in Kansas City Map

Zip Codes with the Highest Percentage of Not-for-profit Organizations in Kansas City, MO

Zip Code % Employed in Not-for-profit vs State vs National
1.6414740.0%10.2%(+29.8)#88.4%(+31.6)#232
2.6413625.1%10.2%(+14.9)#288.4%(+16.6)#690
3.6415316.9%10.2%(+6.72)#798.4%(+8.46)#2,052
4.6411315.0%10.2%(+4.80)#1168.4%(+6.54)#2,958
5.6411014.3%10.2%(+4.11)#1298.4%(+5.84)#3,372
6.6414613.1%10.2%(+2.92)#1658.4%(+4.65)#4,423
7.6412013.0%10.2%(+2.82)#1688.4%(+4.55)#4,512
8.6410813.0%10.2%(+2.78)#1708.4%(+4.52)#4,537
9.6413112.7%10.2%(+2.56)#1748.4%(+4.30)#4,782
10.6415512.7%10.2%(+2.49)#1788.4%(+4.22)#4,867
11.6411612.5%10.2%(+2.31)#1818.4%(+4.05)#5,054
12.6411112.2%10.2%(+2.06)#1948.4%(+3.80)#5,324
13.6411212.1%10.2%(+1.92)#1968.4%(+3.66)#5,514
14.6414512.1%10.2%(+1.92)#1978.4%(+3.66)#5,515
15.6412612.1%10.2%(+1.91)#1998.4%(+3.64)#5,535
16.6410911.7%10.2%(+1.52)#2178.4%(+3.26)#6,044
17.6413911.6%10.2%(+1.44)#2228.4%(+3.18)#6,155
18.6412411.5%10.2%(+1.28)#2268.4%(+3.02)#6,357
19.6415611.4%10.2%(+1.25)#2288.4%(+2.99)#6,402
20.6415810.9%10.2%(+0.672)#2608.4%(+2.41)#7,290
21.6410610.6%10.2%(+0.464)#2798.4%(+2.20)#7,657
22.6415210.3%10.2%(+0.076)#3038.4%(+1.81)#8,385
23.6412910.1%10.2%(-0.128)#3098.4%(+1.61)#8,805
24.6415710.0%10.2%(-0.229)#3158.4%(+1.51)#8,998
25.641309.8%10.2%(-0.417)#3258.4%(+1.32)#9,381
26.641149.7%10.2%(-0.455)#3298.4%(+1.28)#9,472
27.641279.7%10.2%(-0.464)#3308.4%(+1.27)#9,492
28.641179.4%10.2%(-0.793)#3488.4%(+0.944)#10,186
29.641519.3%10.2%(-0.896)#3568.4%(+0.841)#10,394
30.641188.9%10.2%(-1.25)#3828.4%(+0.491)#11,213
31.641198.9%10.2%(-1.26)#3858.4%(+0.477)#11,247
32.641548.7%10.2%(-1.53)#4088.4%(+0.207)#11,908
33.641238.6%10.2%(-1.61)#4148.4%(+0.131)#12,078
34.641388.3%10.2%(-1.84)#4318.4%(-0.100)#12,702
35.641258.1%10.2%(-2.11)#4588.4%(-0.376)#13,441
36.641617.8%10.2%(-2.37)#4928.4%(-0.632)#14,145
37.641327.4%10.2%(-2.75)#5198.4%(-1.01)#15,274
38.641057.4%10.2%(-2.79)#5258.4%(-1.05)#15,388
39.641287.4%10.2%(-2.83)#5288.4%(-1.09)#15,520
40.641337.1%10.2%(-3.08)#5528.4%(-1.34)#16,279
41.641346.8%10.2%(-3.34)#5798.4%(-1.61)#17,049
42.641376.3%10.2%(-3.86)#6278.4%(-2.12)#18,550
43.641634.5%10.2%(-5.66)#7598.4%(-3.93)#23,507
44.641493.8%10.2%(-6.41)#8058.4%(-4.67)#25,195

Common Questions

What are the Top 10 Zip Codes with the Highest Percentage of Not-for-profit Organizations in Kansas City, MO?
Top 10 Zip Codes with the Highest Percentage of Not-for-profit Organizations in Kansas City, MO are:
#1
40.0%
#2
25.1%
#3
16.9%
#4
15.0%
#5
14.3%
#6
13.1%
#7
13.0%
#8
13.0%
#9
12.7%
#10
12.7%
What zip code has the Highest Percentage of Not-for-profit Organizations in Kansas City, MO?
64147 has the Highest Percentage of Not-for-profit Organizations in Kansas City, MO with 40.0%.
What is the Percentage of Not-for-profit Organizations in Kansas City, MO?
Percentage of Not-for-profit Organizations in Kansas City is 10.6%.
What is the Percentage of Not-for-profit Organizations in Missouri?
Percentage of Not-for-profit Organizations in Missouri is 10.2%.
What is the Percentage of Not-for-profit Organizations in the United States?
Percentage of Not-for-profit Organizations in the United States is 8.4%.