Zip Codes with the Lowest Percentage of Renter-Occupied Units in Kansas City, MO
RELATED REPORTS & OPTIONS
Lowest Renter-Occupied
Kansas City
Compare Zip Codes
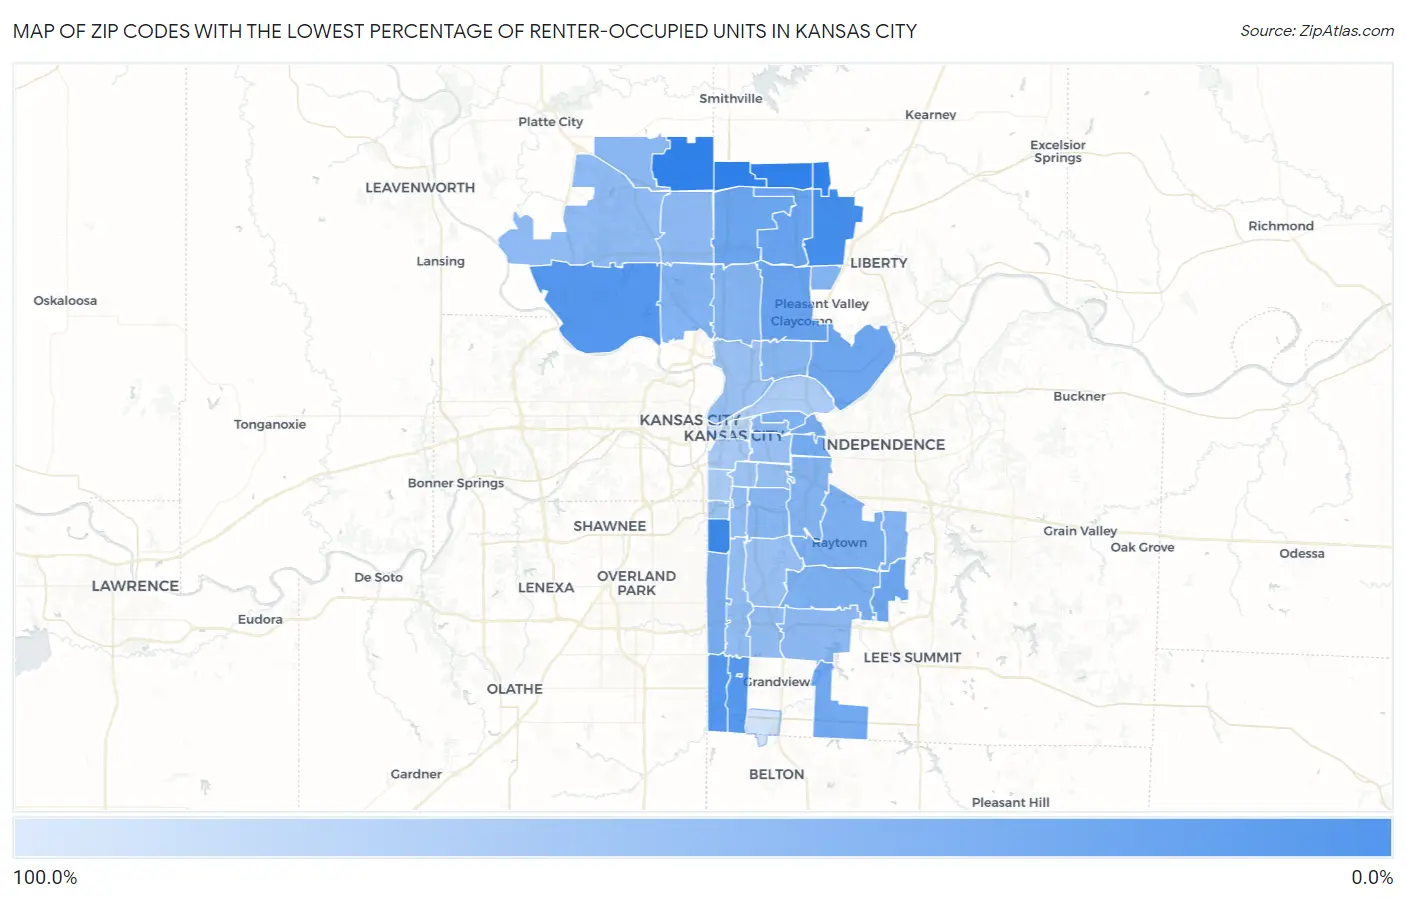
Map of Zip Codes with the Lowest Percentage of Renter-Occupied Units in Kansas City
100.0%
5.2%
Zip Codes with the Lowest Percentage of Renter-Occupied Units in Kansas City, MO
| Zip Code | % Renter-Occupied | vs State | vs National | |
| 1. | 64113 | 5.2% | 32.4%(-27.2)#42 | 35.2%(-30.0)#1,113 |
| 2. | 64157 | 9.6% | 32.4%(-22.8)#118 | 35.2%(-25.6)#3,531 |
| 3. | 64145 | 16.9% | 32.4%(-15.5)#318 | 35.2%(-18.3)#9,828 |
| 4. | 64152 | 17.1% | 32.4%(-15.3)#322 | 35.2%(-18.1)#10,013 |
| 5. | 64146 | 18.4% | 32.4%(-14.0)#368 | 35.2%(-16.8)#11,293 |
| 6. | 64119 | 26.5% | 32.4%(-5.86)#598 | 35.2%(-8.64)#18,668 |
| 7. | 64156 | 26.9% | 32.4%(-5.52)#609 | 35.2%(-8.30)#18,926 |
| 8. | 64155 | 29.4% | 32.4%(-3.00)#673 | 35.2%(-5.79)#20,650 |
| 9. | 64139 | 31.0% | 32.4%(-1.44)#701 | 35.2%(-4.22)#21,644 |
| 10. | 64161 | 31.2% | 32.4%(-1.24)#709 | 35.2%(-4.02)#21,749 |
| 11. | 64149 | 31.9% | 32.4%(-0.547)#728 | 35.2%(-3.33)#22,168 |
| 12. | 64126 | 35.4% | 32.4%(+2.96)#780 | 35.2%(+0.176)#23,923 |
| 13. | 64125 | 35.9% | 32.4%(+3.49)#788 | 35.2%(+0.710)#24,155 |
| 14. | 64114 | 36.8% | 32.4%(+4.40)#800 | 35.2%(+1.62)#24,529 |
| 15. | 64133 | 39.6% | 32.4%(+7.15)#827 | 35.2%(+4.37)#25,562 |
| 16. | 64138 | 40.4% | 32.4%(+8.02)#834 | 35.2%(+5.23)#25,824 |
| 17. | 64151 | 41.0% | 32.4%(+8.56)#838 | 35.2%(+5.77)#25,972 |
| 18. | 64123 | 41.6% | 32.4%(+9.25)#841 | 35.2%(+6.46)#26,179 |
| 19. | 64118 | 42.3% | 32.4%(+9.94)#846 | 35.2%(+7.16)#26,356 |
| 20. | 64158 | 43.4% | 32.4%(+11.0)#852 | 35.2%(+8.26)#26,644 |
| 21. | 64129 | 43.6% | 32.4%(+11.2)#854 | 35.2%(+8.41)#26,682 |
| 22. | 64136 | 44.3% | 32.4%(+11.9)#857 | 35.2%(+9.09)#26,847 |
| 23. | 64117 | 45.4% | 32.4%(+13.0)#868 | 35.2%(+10.2)#27,129 |
| 24. | 64130 | 46.4% | 32.4%(+14.0)#875 | 35.2%(+11.2)#27,354 |
| 25. | 64163 | 47.4% | 32.4%(+15.0)#879 | 35.2%(+12.3)#27,547 |
| 26. | 64154 | 48.9% | 32.4%(+16.5)#889 | 35.2%(+13.7)#27,815 |
| 27. | 64134 | 49.3% | 32.4%(+16.9)#891 | 35.2%(+14.1)#27,895 |
| 28. | 64153 | 49.6% | 32.4%(+17.2)#894 | 35.2%(+14.5)#27,946 |
| 29. | 64124 | 50.4% | 32.4%(+18.0)#899 | 35.2%(+15.3)#28,084 |
| 30. | 64137 | 51.8% | 32.4%(+19.4)#904 | 35.2%(+16.7)#28,310 |
| 31. | 64110 | 52.2% | 32.4%(+19.8)#907 | 35.2%(+17.0)#28,366 |
| 32. | 64131 | 53.6% | 32.4%(+21.2)#908 | 35.2%(+18.5)#28,581 |
| 33. | 64128 | 55.4% | 32.4%(+23.0)#916 | 35.2%(+20.2)#28,816 |
| 34. | 64127 | 57.1% | 32.4%(+24.7)#921 | 35.2%(+21.9)#29,004 |
| 35. | 64132 | 57.2% | 32.4%(+24.9)#922 | 35.2%(+22.1)#29,029 |
| 36. | 64116 | 57.5% | 32.4%(+25.1)#925 | 35.2%(+22.3)#29,048 |
| 37. | 64112 | 58.1% | 32.4%(+25.7)#929 | 35.2%(+22.9)#29,118 |
| 38. | 64109 | 60.0% | 32.4%(+27.6)#935 | 35.2%(+24.8)#29,291 |
| 39. | 64108 | 65.4% | 32.4%(+33.0)#940 | 35.2%(+30.2)#29,748 |
| 40. | 64111 | 69.0% | 32.4%(+36.6)#943 | 35.2%(+33.8)#29,984 |
| 41. | 64120 | 70.7% | 32.4%(+38.3)#944 | 35.2%(+35.5)#30,073 |
| 42. | 64105 | 84.5% | 32.4%(+52.1)#950 | 35.2%(+49.3)#30,537 |
| 43. | 64106 | 84.5% | 32.4%(+52.1)#951 | 35.2%(+49.3)#30,538 |
| 44. | 64147 | 100.0% | 32.4%(+67.6)#957 | 35.2%(+64.8)#30,918 |
| 45. | 64101 | 100.0% | 32.4%(+67.6)#959 | 35.2%(+64.8)#30,983 |
1
Common Questions
What are the Top 10 Zip Codes with the Lowest Percentage of Renter-Occupied Units in Kansas City, MO?
Top 10 Zip Codes with the Lowest Percentage of Renter-Occupied Units in Kansas City, MO are:
What zip code has the Lowest Percentage of Renter-Occupied Units in Kansas City, MO?
64113 has the Lowest Percentage of Renter-Occupied Units in Kansas City, MO with 5.2%.
What is the Percentage of Renter-Occupied Units in Kansas City, MO?
Percentage of Renter-Occupied Units in Kansas City is 46.0%.
What is the Percentage of Renter-Occupied Units in Missouri?
Percentage of Renter-Occupied Units in Missouri is 32.4%.
What is the Percentage of Renter-Occupied Units in the United States?
Percentage of Renter-Occupied Units in the United States is 35.2%.