Zip Codes with the Highest Percentage of Population Employed in Administrative & Support Services in Kansas City, MO
RELATED REPORTS & OPTIONS
Administrative & Support Services
Kansas City
Compare Zip Codes
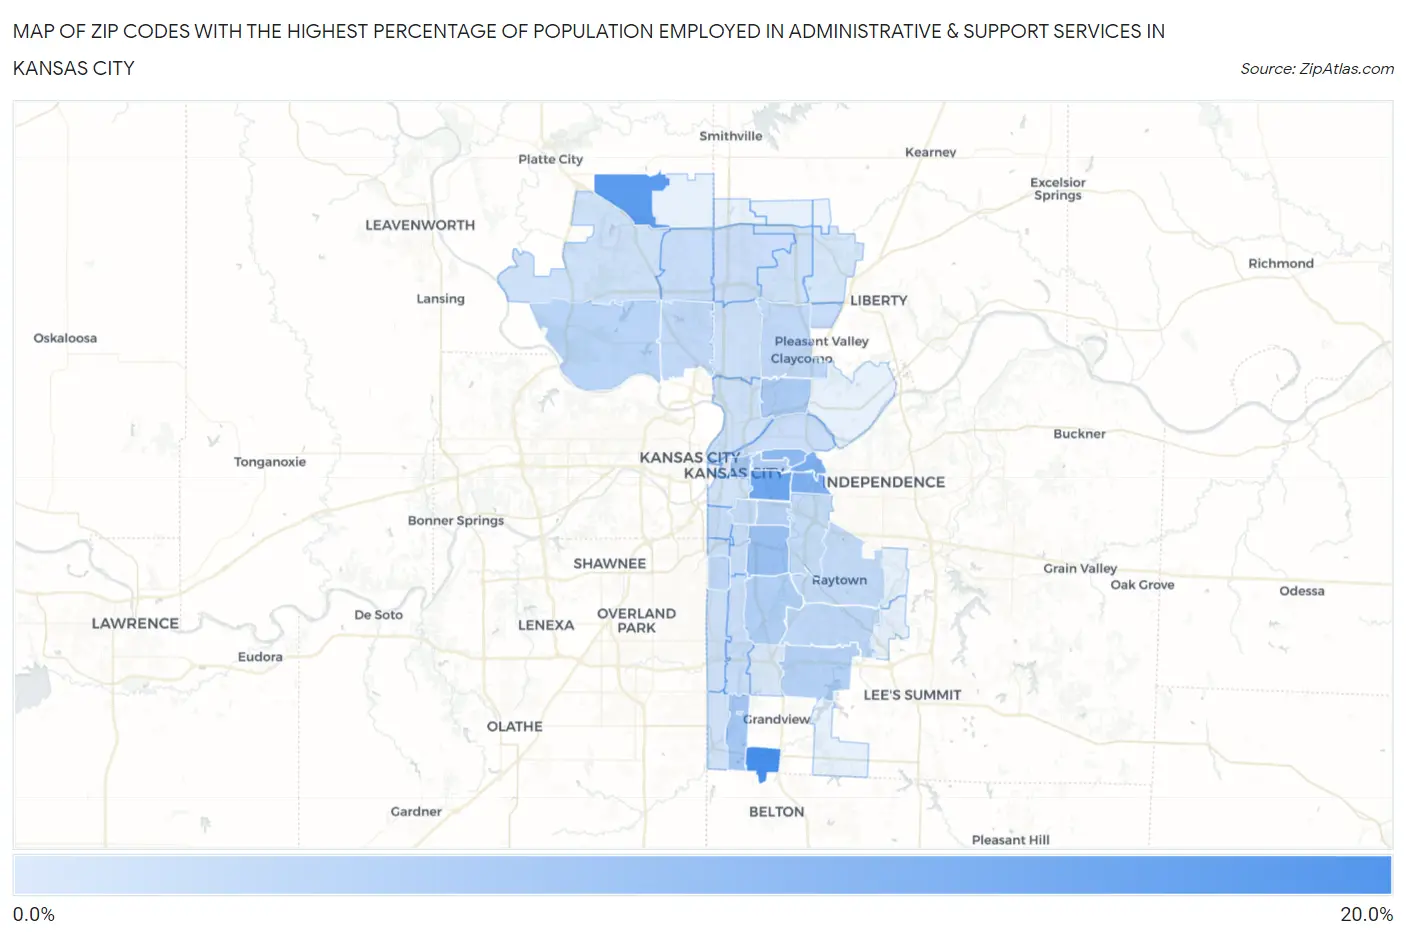
Map of Zip Codes with the Highest Percentage of Population Employed in Administrative & Support Services in Kansas City
0.95%
17.6%
Zip Codes with the Highest Percentage of Population Employed in Administrative & Support Services in Kansas City, MO
| Zip Code | % Employed | vs State | vs National | |
| 1. | 64147 | 17.6% | 3.6%(+14.1)#10 | 4.1%(+13.5)#366 |
| 2. | 64163 | 15.3% | 3.6%(+11.7)#17 | 4.1%(+11.2)#506 |
| 3. | 64127 | 13.0% | 3.6%(+9.39)#23 | 4.1%(+8.83)#724 |
| 4. | 64125 | 11.2% | 3.6%(+7.63)#30 | 4.1%(+7.06)#977 |
| 5. | 64126 | 10.9% | 3.6%(+7.28)#33 | 4.1%(+6.72)#1,053 |
| 6. | 64123 | 9.2% | 3.6%(+5.58)#51 | 4.1%(+5.01)#1,602 |
| 7. | 64130 | 7.9% | 3.6%(+4.33)#79 | 4.1%(+3.76)#2,345 |
| 8. | 64106 | 6.9% | 3.6%(+3.31)#101 | 4.1%(+2.74)#3,361 |
| 9. | 64146 | 6.8% | 3.6%(+3.20)#104 | 4.1%(+2.63)#3,503 |
| 10. | 64117 | 6.2% | 3.6%(+2.60)#128 | 4.1%(+2.03)#4,450 |
| 11. | 64124 | 5.4% | 3.6%(+1.78)#170 | 4.1%(+1.21)#6,164 |
| 12. | 64132 | 5.3% | 3.6%(+1.67)#174 | 4.1%(+1.11)#6,455 |
| 13. | 64134 | 5.0% | 3.6%(+1.45)#191 | 4.1%(+0.880)#7,025 |
| 14. | 64128 | 4.9% | 3.6%(+1.30)#196 | 4.1%(+0.736)#7,449 |
| 15. | 64152 | 4.5% | 3.6%(+0.959)#215 | 4.1%(+0.393)#8,579 |
| 16. | 64138 | 4.0% | 3.6%(+0.431)#271 | 4.1%(-0.135)#10,628 |
| 17. | 64113 | 3.9% | 3.6%(+0.310)#289 | 4.1%(-0.256)#11,140 |
| 18. | 64151 | 3.9% | 3.6%(+0.272)#293 | 4.1%(-0.294)#11,299 |
| 19. | 64119 | 3.9% | 3.6%(+0.271)#294 | 4.1%(-0.295)#11,301 |
| 20. | 64133 | 3.6% | 3.6%(+0.051)#320 | 4.1%(-0.515)#12,300 |
| 21. | 64109 | 3.5% | 3.6%(-0.047)#331 | 4.1%(-0.613)#12,781 |
| 22. | 64111 | 3.5% | 3.6%(-0.121)#342 | 4.1%(-0.687)#13,152 |
| 23. | 64129 | 3.4% | 3.6%(-0.195)#351 | 4.1%(-0.761)#13,497 |
| 24. | 64158 | 3.2% | 3.6%(-0.367)#373 | 4.1%(-0.933)#14,388 |
| 25. | 64154 | 3.1% | 3.6%(-0.481)#386 | 4.1%(-1.05)#14,983 |
| 26. | 64110 | 3.1% | 3.6%(-0.503)#388 | 4.1%(-1.07)#15,091 |
| 27. | 64131 | 2.9% | 3.6%(-0.660)#406 | 4.1%(-1.23)#15,873 |
| 28. | 64120 | 2.9% | 3.6%(-0.666)#408 | 4.1%(-1.23)#15,906 |
| 29. | 64155 | 2.9% | 3.6%(-0.689)#413 | 4.1%(-1.26)#16,029 |
| 30. | 64112 | 2.7% | 3.6%(-0.869)#439 | 4.1%(-1.44)#17,006 |
| 31. | 64118 | 2.6% | 3.6%(-0.993)#458 | 4.1%(-1.56)#17,655 |
| 32. | 64116 | 2.5% | 3.6%(-1.10)#475 | 4.1%(-1.66)#18,197 |
| 33. | 64156 | 2.4% | 3.6%(-1.19)#489 | 4.1%(-1.75)#18,677 |
| 34. | 64153 | 2.4% | 3.6%(-1.21)#493 | 4.1%(-1.78)#18,816 |
| 35. | 64114 | 2.3% | 3.6%(-1.24)#499 | 4.1%(-1.81)#18,996 |
| 36. | 64108 | 2.2% | 3.6%(-1.37)#523 | 4.1%(-1.94)#19,610 |
| 37. | 64145 | 2.2% | 3.6%(-1.40)#528 | 4.1%(-1.97)#19,738 |
| 38. | 64157 | 1.7% | 3.6%(-1.85)#598 | 4.1%(-2.41)#21,803 |
| 39. | 64137 | 1.4% | 3.6%(-2.19)#647 | 4.1%(-2.76)#23,141 |
| 40. | 64105 | 0.95% | 3.6%(-2.63)#700 | 4.1%(-3.20)#24,652 |
1
Common Questions
What are the Top 10 Zip Codes with the Highest Percentage of Population Employed in Administrative & Support Services in Kansas City, MO?
Top 10 Zip Codes with the Highest Percentage of Population Employed in Administrative & Support Services in Kansas City, MO are:
What zip code has the Highest Percentage of Population Employed in Administrative & Support Services in Kansas City, MO?
64147 has the Highest Percentage of Population Employed in Administrative & Support Services in Kansas City, MO with 17.6%.
What is the Percentage of Population Employed in Administrative & Support Services in Kansas City, MO?
Percentage of Population Employed in Administrative & Support Services in Kansas City is 4.0%.
What is the Percentage of Population Employed in Administrative & Support Services in Missouri?
Percentage of Population Employed in Administrative & Support Services in Missouri is 3.6%.
What is the Percentage of Population Employed in Administrative & Support Services in the United States?
Percentage of Population Employed in Administrative & Support Services in the United States is 4.1%.