Zip Codes with the Highest Percentage of Population with a Degree in Liberal Arts and History in Kansas City, MO
RELATED REPORTS & OPTIONS
Liberal Arts and History
Kansas City
Compare Zip Codes
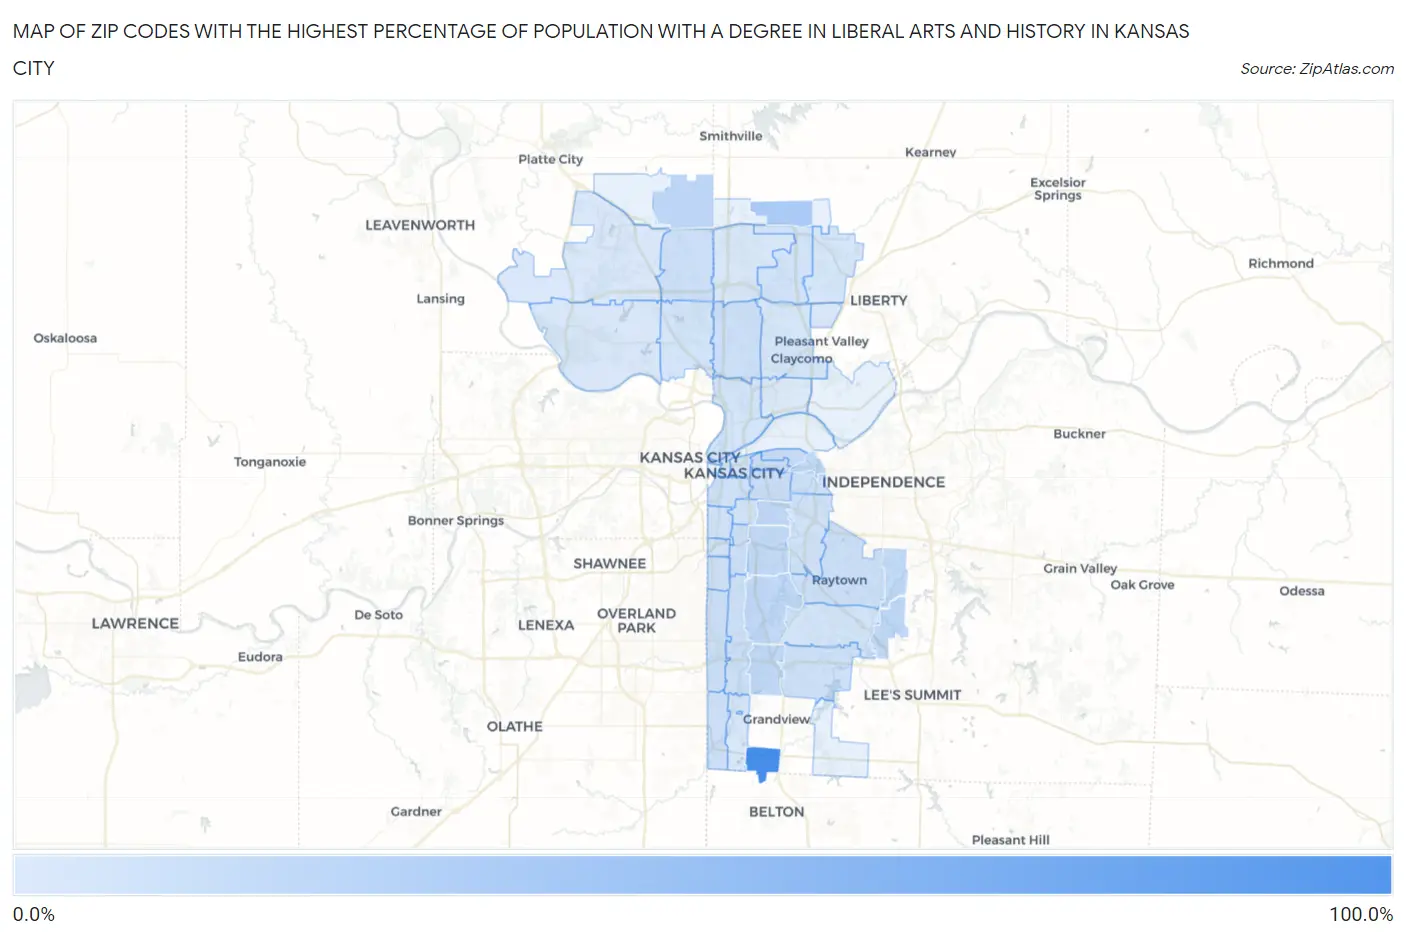
Map of Zip Codes with the Highest Percentage of Population with a Degree in Liberal Arts and History in Kansas City
0.11%
100.0%
Zip Codes with the Highest Percentage of Population with a Degree in Liberal Arts and History in Kansas City, MO
| Zip Code | % Graduates | vs State | vs National | |
| 1. | 64147 | 100.0% | 4.6%(+95.4)#1 | 4.9%(+95.1)#12 |
| 2. | 64166 | 26.7% | 4.6%(+22.1)#20 | 4.9%(+21.8)#510 |
| 3. | 64164 | 15.7% | 4.6%(+11.1)#48 | 4.9%(+10.8)#1,306 |
| 4. | 64125 | 14.3% | 4.6%(+9.72)#56 | 4.9%(+9.41)#1,558 |
| 5. | 64128 | 13.9% | 4.6%(+9.36)#64 | 4.9%(+9.06)#1,658 |
| 6. | 64137 | 13.8% | 4.6%(+9.23)#65 | 4.9%(+8.93)#1,681 |
| 7. | 64139 | 13.7% | 4.6%(+9.09)#66 | 4.9%(+8.78)#1,718 |
| 8. | 64132 | 13.6% | 4.6%(+9.02)#67 | 4.9%(+8.72)#1,744 |
| 9. | 64136 | 13.1% | 4.6%(+8.54)#71 | 4.9%(+8.24)#1,876 |
| 10. | 64130 | 13.0% | 4.6%(+8.38)#72 | 4.9%(+8.08)#1,922 |
| 11. | 64123 | 9.9% | 4.6%(+5.35)#102 | 4.9%(+5.05)#3,153 |
| 12. | 64127 | 8.8% | 4.6%(+4.20)#129 | 4.9%(+3.90)#4,059 |
| 13. | 64124 | 8.7% | 4.6%(+4.13)#133 | 4.9%(+3.83)#4,121 |
| 14. | 64110 | 8.1% | 4.6%(+3.53)#150 | 4.9%(+3.22)#4,782 |
| 15. | 64114 | 7.9% | 4.6%(+3.37)#157 | 4.9%(+3.07)#4,974 |
| 16. | 64133 | 7.9% | 4.6%(+3.31)#160 | 4.9%(+3.01)#5,060 |
| 17. | 64154 | 7.7% | 4.6%(+3.11)#163 | 4.9%(+2.80)#5,341 |
| 18. | 64118 | 7.4% | 4.6%(+2.81)#168 | 4.9%(+2.51)#5,766 |
| 19. | 64131 | 7.3% | 4.6%(+2.71)#173 | 4.9%(+2.41)#5,901 |
| 20. | 64108 | 7.3% | 4.6%(+2.70)#174 | 4.9%(+2.40)#5,936 |
| 21. | 64113 | 7.3% | 4.6%(+2.70)#175 | 4.9%(+2.39)#5,938 |
| 22. | 64145 | 6.5% | 4.6%(+1.90)#207 | 4.9%(+1.60)#7,410 |
| 23. | 64134 | 6.2% | 4.6%(+1.68)#221 | 4.9%(+1.37)#7,924 |
| 24. | 64126 | 6.2% | 4.6%(+1.59)#229 | 4.9%(+1.29)#8,119 |
| 25. | 64156 | 6.1% | 4.6%(+1.52)#232 | 4.9%(+1.22)#8,294 |
| 26. | 64111 | 5.6% | 4.6%(+1.05)#251 | 4.9%(+0.748)#9,518 |
| 27. | 64112 | 5.1% | 4.6%(+0.548)#284 | 4.9%(+0.246)#10,981 |
| 28. | 64129 | 5.1% | 4.6%(+0.546)#285 | 4.9%(+0.244)#10,985 |
| 29. | 64151 | 5.0% | 4.6%(+0.397)#296 | 4.9%(+0.095)#11,446 |
| 30. | 64116 | 4.6% | 4.6%(+0.044)#321 | 4.9%(-0.258)#12,605 |
| 31. | 64138 | 4.5% | 4.6%(-0.091)#328 | 4.9%(-0.393)#13,028 |
| 32. | 64109 | 4.4% | 4.6%(-0.177)#336 | 4.9%(-0.479)#13,312 |
| 33. | 64106 | 4.1% | 4.6%(-0.487)#359 | 4.9%(-0.788)#14,452 |
| 34. | 64119 | 3.7% | 4.6%(-0.911)#413 | 4.9%(-1.21)#16,038 |
| 35. | 64157 | 3.0% | 4.6%(-1.56)#475 | 4.9%(-1.86)#18,316 |
| 36. | 64155 | 2.8% | 4.6%(-1.79)#490 | 4.9%(-2.09)#19,062 |
| 37. | 64152 | 2.8% | 4.6%(-1.81)#494 | 4.9%(-2.11)#19,138 |
| 38. | 64105 | 2.6% | 4.6%(-1.99)#509 | 4.9%(-2.29)#19,718 |
| 39. | 64158 | 2.5% | 4.6%(-2.06)#513 | 4.9%(-2.36)#19,931 |
| 40. | 64153 | 0.97% | 4.6%(-3.60)#632 | 4.9%(-3.90)#23,439 |
| 41. | 64146 | 0.96% | 4.6%(-3.61)#633 | 4.9%(-3.91)#23,448 |
| 42. | 64117 | 0.11% | 4.6%(-4.46)#658 | 4.9%(-4.76)#24,218 |
1
Common Questions
What are the Top 10 Zip Codes with the Highest Percentage of Population with a Degree in Liberal Arts and History in Kansas City, MO?
Top 10 Zip Codes with the Highest Percentage of Population with a Degree in Liberal Arts and History in Kansas City, MO are:
What zip code has the Highest Percentage of Population with a Degree in Liberal Arts and History in Kansas City, MO?
64147 has the Highest Percentage of Population with a Degree in Liberal Arts and History in Kansas City, MO with 100.0%.
What is the Percentage of Population with a Degree in Liberal Arts and History in Kansas City, MO?
Percentage of Population with a Degree in Liberal Arts and History in Kansas City is 6.0%.
What is the Percentage of Population with a Degree in Liberal Arts and History in Missouri?
Percentage of Population with a Degree in Liberal Arts and History in Missouri is 4.6%.
What is the Percentage of Population with a Degree in Liberal Arts and History in the United States?
Percentage of Population with a Degree in Liberal Arts and History in the United States is 4.9%.