Zip Codes with the Highest Percentage of Population Employed in Architecture & Engineering in Kansas City, MO
RELATED REPORTS & OPTIONS
Architecture & Engineering
Kansas City
Compare Zip Codes
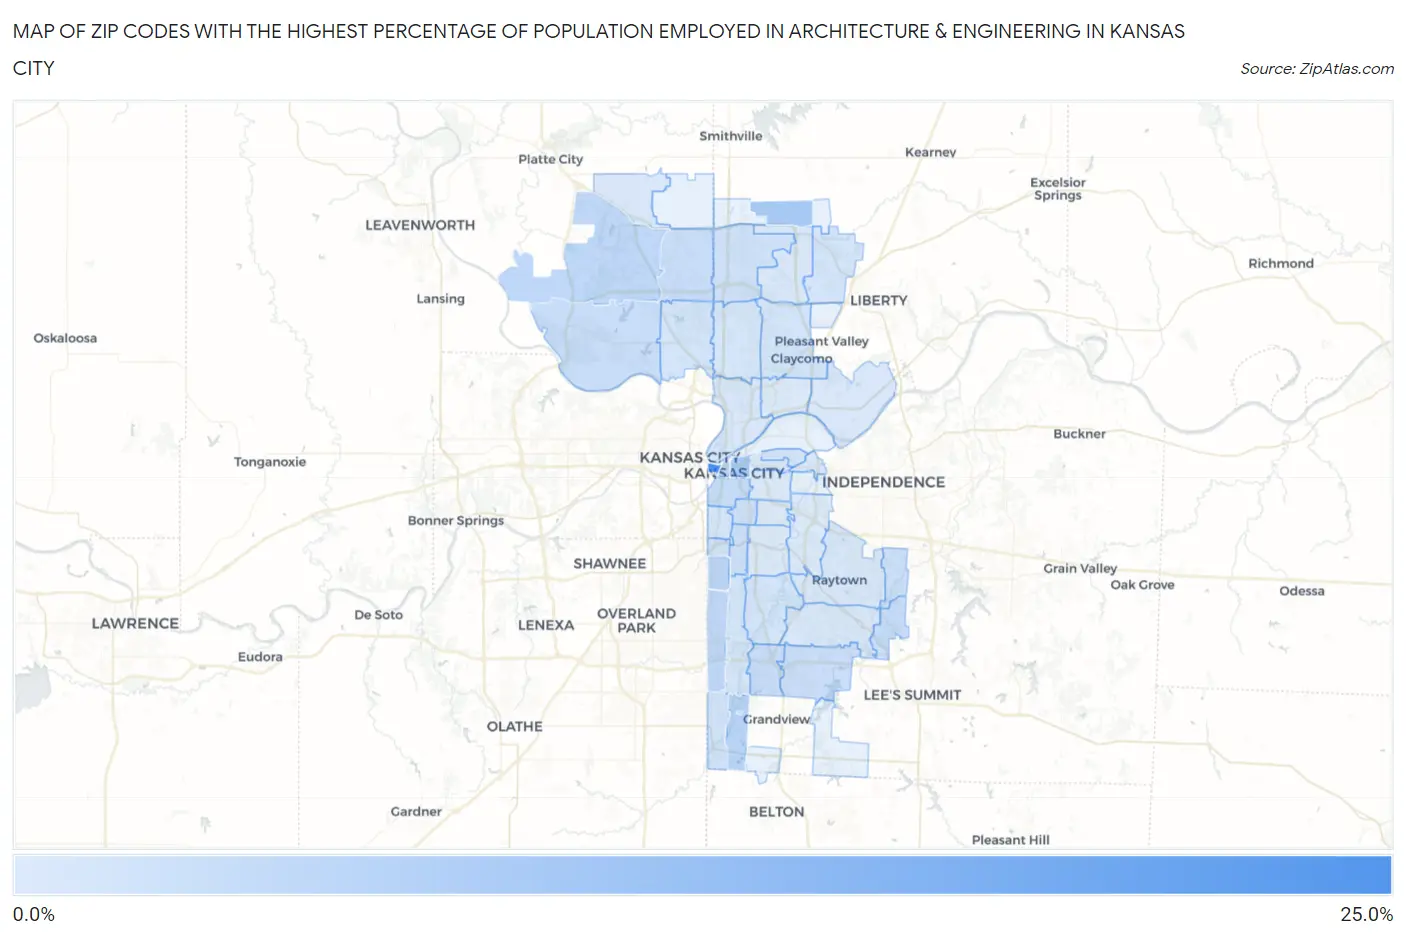
Map of Zip Codes with the Highest Percentage of Population Employed in Architecture & Engineering in Kansas City
0.26%
24.6%
Zip Codes with the Highest Percentage of Population Employed in Architecture & Engineering in Kansas City, MO
| Zip Code | % Employed | vs State | vs National | |
| 1. | 64101 | 24.6% | 1.7%(+22.9)#3 | 2.1%(+22.5)#66 |
| 2. | 64166 | 8.2% | 1.7%(+6.46)#15 | 2.1%(+6.01)#545 |
| 3. | 64106 | 7.4% | 1.7%(+5.71)#18 | 2.1%(+5.27)#668 |
| 4. | 64146 | 5.4% | 1.7%(+3.69)#23 | 2.1%(+3.24)#1,390 |
| 5. | 64113 | 5.2% | 1.7%(+3.51)#24 | 2.1%(+3.06)#1,509 |
| 6. | 64105 | 5.0% | 1.7%(+3.32)#28 | 2.1%(+2.88)#1,644 |
| 7. | 64153 | 4.7% | 1.7%(+3.04)#34 | 2.1%(+2.59)#1,886 |
| 8. | 64114 | 4.4% | 1.7%(+2.71)#38 | 2.1%(+2.26)#2,245 |
| 9. | 64108 | 3.5% | 1.7%(+1.84)#61 | 2.1%(+1.39)#3,629 |
| 10. | 64152 | 3.5% | 1.7%(+1.75)#65 | 2.1%(+1.31)#3,842 |
| 11. | 64137 | 3.5% | 1.7%(+1.75)#66 | 2.1%(+1.31)#3,843 |
| 12. | 64154 | 3.3% | 1.7%(+1.63)#71 | 2.1%(+1.18)#4,124 |
| 13. | 64139 | 3.3% | 1.7%(+1.56)#74 | 2.1%(+1.11)#4,299 |
| 14. | 64134 | 2.8% | 1.7%(+1.12)#95 | 2.1%(+0.679)#5,672 |
| 15. | 64136 | 2.8% | 1.7%(+1.05)#105 | 2.1%(+0.607)#5,940 |
| 16. | 64110 | 2.7% | 1.7%(+1.02)#110 | 2.1%(+0.573)#6,074 |
| 17. | 64109 | 2.7% | 1.7%(+0.995)#113 | 2.1%(+0.550)#6,166 |
| 18. | 64155 | 2.2% | 1.7%(+0.487)#150 | 2.1%(+0.042)#8,522 |
| 19. | 64112 | 2.1% | 1.7%(+0.421)#162 | 2.1%(-0.024)#8,893 |
| 20. | 64145 | 2.1% | 1.7%(+0.389)#166 | 2.1%(-0.056)#9,090 |
| 21. | 64157 | 1.8% | 1.7%(+0.067)#215 | 2.1%(-0.378)#10,997 |
| 22. | 64151 | 1.6% | 1.7%(-0.106)#240 | 2.1%(-0.551)#12,194 |
| 23. | 64123 | 1.6% | 1.7%(-0.125)#242 | 2.1%(-0.570)#12,309 |
| 24. | 64132 | 1.5% | 1.7%(-0.233)#256 | 2.1%(-0.678)#13,082 |
| 25. | 64119 | 1.5% | 1.7%(-0.239)#258 | 2.1%(-0.684)#13,129 |
| 26. | 64111 | 1.4% | 1.7%(-0.347)#280 | 2.1%(-0.792)#13,907 |
| 27. | 64131 | 1.3% | 1.7%(-0.426)#292 | 2.1%(-0.871)#14,463 |
| 28. | 64118 | 1.2% | 1.7%(-0.531)#307 | 2.1%(-0.976)#15,297 |
| 29. | 64116 | 1.1% | 1.7%(-0.612)#330 | 2.1%(-1.06)#15,918 |
| 30. | 64156 | 1.0% | 1.7%(-0.661)#338 | 2.1%(-1.11)#16,282 |
| 31. | 64163 | 1.0% | 1.7%(-0.696)#348 | 2.1%(-1.14)#16,541 |
| 32. | 64133 | 0.87% | 1.7%(-0.830)#377 | 2.1%(-1.27)#17,570 |
| 33. | 64138 | 0.85% | 1.7%(-0.850)#388 | 2.1%(-1.29)#17,724 |
| 34. | 64161 | 0.71% | 1.7%(-0.990)#428 | 2.1%(-1.43)#18,793 |
| 35. | 64124 | 0.64% | 1.7%(-1.06)#440 | 2.1%(-1.51)#19,310 |
| 36. | 64125 | 0.52% | 1.7%(-1.18)#461 | 2.1%(-1.63)#20,130 |
| 37. | 64128 | 0.41% | 1.7%(-1.30)#492 | 2.1%(-1.74)#20,900 |
| 38. | 64130 | 0.37% | 1.7%(-1.33)#506 | 2.1%(-1.78)#21,142 |
| 39. | 64117 | 0.34% | 1.7%(-1.36)#515 | 2.1%(-1.81)#21,326 |
| 40. | 64127 | 0.33% | 1.7%(-1.38)#522 | 2.1%(-1.82)#21,400 |
| 41. | 64129 | 0.26% | 1.7%(-1.44)#537 | 2.1%(-1.89)#21,761 |
1
Common Questions
What are the Top 10 Zip Codes with the Highest Percentage of Population Employed in Architecture & Engineering in Kansas City, MO?
Top 10 Zip Codes with the Highest Percentage of Population Employed in Architecture & Engineering in Kansas City, MO are:
What zip code has the Highest Percentage of Population Employed in Architecture & Engineering in Kansas City, MO?
64101 has the Highest Percentage of Population Employed in Architecture & Engineering in Kansas City, MO with 24.6%.
What is the Percentage of Population Employed in Architecture & Engineering in Kansas City, MO?
Percentage of Population Employed in Architecture & Engineering in Kansas City is 2.0%.
What is the Percentage of Population Employed in Architecture & Engineering in Missouri?
Percentage of Population Employed in Architecture & Engineering in Missouri is 1.7%.
What is the Percentage of Population Employed in Architecture & Engineering in the United States?
Percentage of Population Employed in Architecture & Engineering in the United States is 2.1%.