Zip Codes with the Largest French Community in Kansas City, MO

RELATED REPORTS & OPTIONS

French
Population
Families and Households
Female Fertility
Female Fertility (Unmarried)
Race (Community Size)
Race (Percentage)
Ancestry (Community Size)
AfghanAfricanAlaska NativeAlbanianAmericanApacheArabArgentineanArmenianAustralianAustrianBahamianBangladeshiBelgianBelizeanBhutaneseBlackfeetBolivianBrazilianBritishBulgarianBurmeseCanadianCelticCentral AmericanCentral American IndianCherokeeChickasawChileanChippewaChoctawColombianComancheCosta RicanCreeCreekCroatianCrowCubanCzechCzechoslovakianDanishDominicanDutchDutch West IndianEastern EuropeanEcuadorianEgyptianEnglishEthiopianEuropeanFijianFilipinoFinnishFrenchFrench American IndianFrench CanadianGermanGerman RussianGhanaianGreekGuamanian / ChamorroGuatemalanGuyaneseHaitianHonduranHungarianIcelanderIndian (Asian)IndonesianIranianIraqiIrishIroquoisIsraeliItalianJamaicanJapaneseJordanianKenyanKoreanLaotianLatvianLebaneseLiberianLithuanianLuxembourgerMalaysianMexicanMexican American IndianMongolianMoroccanNative HawaiianNavajoNew ZealanderNicaraguanNigerianNorthern EuropeanNorwegianOsageOttawaPakistaniPalestinianPanamanianPennsylvania GermanPeruvianPolishPortuguesePotawatomiPuebloPuerto RicanRomanianRussianSalvadoranSamoanScandinavianScotch-IrishScottishSeminoleSerbianShoshoneSierra LeoneanSiouxSlavicSlovakSloveneSomaliSouth AfricanSouth AmericanSouth American IndianSpaniardSpanishSri LankanSubsaharan AfricanSudaneseSwedishSwissSyrianThaiTrinidadian and TobagonianTurkishUgandanUkrainianUruguayanVenezuelanVietnameseWelshWest IndianYugoslavian
Ancestry (Percentage)
AfghanAfricanAlaska NativeAlbanianAmericanApacheArabArgentineanArmenianAustralianAustrianBahamianBangladeshiBelgianBelizeanBhutaneseBlackfeetBolivianBrazilianBritishBulgarianBurmeseCanadianCelticCentral AmericanCentral American IndianCherokeeChickasawChileanChippewaChoctawColombianComancheCosta RicanCreeCreekCroatianCrowCubanCzechCzechoslovakianDanishDominicanDutchDutch West IndianEastern EuropeanEcuadorianEgyptianEnglishEthiopianEuropeanFijianFilipinoFinnishFrenchFrench American IndianFrench CanadianGermanGerman RussianGhanaianGreekGuamanian / ChamorroGuatemalanGuyaneseHaitianHonduranHungarianIcelanderIndian (Asian)IndonesianIranianIraqiIrishIroquoisIsraeliItalianJamaicanJapaneseJordanianKenyanKoreanLaotianLatvianLebaneseLiberianLithuanianLuxembourgerMalaysianMexicanMexican American IndianMongolianMoroccanNative HawaiianNavajoNew ZealanderNicaraguanNigerianNorthern EuropeanNorwegianOsageOttawaPakistaniPalestinianPanamanianPennsylvania GermanPeruvianPolishPortuguesePotawatomiPuebloPuerto RicanRomanianRussianSalvadoranSamoanScandinavianScotch-IrishScottishSeminoleSerbianShoshoneSierra LeoneanSiouxSlavicSlovakSloveneSomaliSouth AfricanSouth AmericanSouth American IndianSpaniardSpanishSri LankanSubsaharan AfricanSudaneseSwedishSwissSyrianThaiTrinidadian and TobagonianTurkishUgandanUkrainianUruguayanVenezuelanVietnameseWelshWest IndianYugoslavian
Immigrant Origin (Total)
AfghanistanAfricaArgentinaAsiaAustraliaBahamasBangladeshBelarusBelgiumBelizeBoliviaBosnia and HerzegovinaBrazilBulgariaBurma / MyanmarCambodiaCameroonCanadaCaribbeanCentral AmericaChileChinaColombiaCongoCosta RicaCubaCzechoslovakiaDenmarkDominican RepublicEastern AfricaEastern AsiaEastern EuropeEcuadorEgyptEl SalvadorEnglandEritreaEthiopiaEuropeFijiFranceGermanyGhanaGreeceGuatemalaGuyanaHaitiHondurasHong KongHungaryIndiaIndonesiaIranIraqIrelandIsraelItalyJamaicaJapanJordanKazakhstanKenyaKoreaKuwaitLaosLatin AmericaLebanonLiberiaMalaysiaMexicoMicronesiaMiddle AfricaMoroccoNepalNetherlandsNicaraguaNigeriaNorthern AfricaNorthern EuropeOceaniaPakistanPeruPhilippinesPolandPortugalRomaniaRussiaSaudi ArabiaScotlandSierra LeoneSomaliaSouth AfricaSouth AmericaSouth Central AsiaSouth Eastern AsiaSouthern EuropeSpainSri LankaSudanSwedenSwitzerlandSyriaTaiwanThailandTrinidad and TobagoTurkeyUgandaUkraineUruguayVenezuelaVietnamWestern AfricaWestern AsiaWestern EuropeZaireZimbabwe
Immigrant Origin (Percentage)
AfghanistanAfricaArgentinaAsiaAustraliaBahamasBangladeshBelarusBelgiumBelizeBoliviaBosnia and HerzegovinaBrazilBulgariaBurma / MyanmarCambodiaCameroonCanadaCaribbeanCentral AmericaChileChinaColombiaCongoCosta RicaCubaCzechoslovakiaDenmarkDominican RepublicEastern AfricaEastern AsiaEastern EuropeEcuadorEgyptEl SalvadorEnglandEritreaEthiopiaEuropeFijiFranceGermanyGhanaGreeceGuatemalaGuyanaHaitiHondurasHong KongHungaryIndiaIndonesiaIranIraqIrelandIsraelItalyJamaicaJapanJordanKazakhstanKenyaKoreaKuwaitLaosLatin AmericaLebanonLiberiaMalaysiaMexicoMicronesiaMiddle AfricaMoroccoNepalNetherlandsNicaraguaNigeriaNorthern AfricaNorthern EuropeOceaniaPakistanPeruPhilippinesPolandPortugalRomaniaRussiaSaudi ArabiaScotlandSierra LeoneSomaliaSouth AfricaSouth AmericaSouth Central AsiaSouth Eastern AsiaSouthern EuropeSpainSri LankaSudanSwedenSwitzerlandSyriaTaiwanThailandTrinidad and TobagoTurkeyUgandaUkraineUruguayVenezuelaVietnamWestern AfricaWestern AsiaWestern EuropeZaireZimbabwe
Income
Income (Families)
Income (Households)
Poverty
Poverty (Families)
Unemployment
Employment Occupations
Employment Industries
Employer Class
Commute Time
Commute Means
School Enrollment
Education by Degree Field
Occupancy
Finances
Physical Characteristics
Kansas City
Compare Zip Codes
Comparison Subject

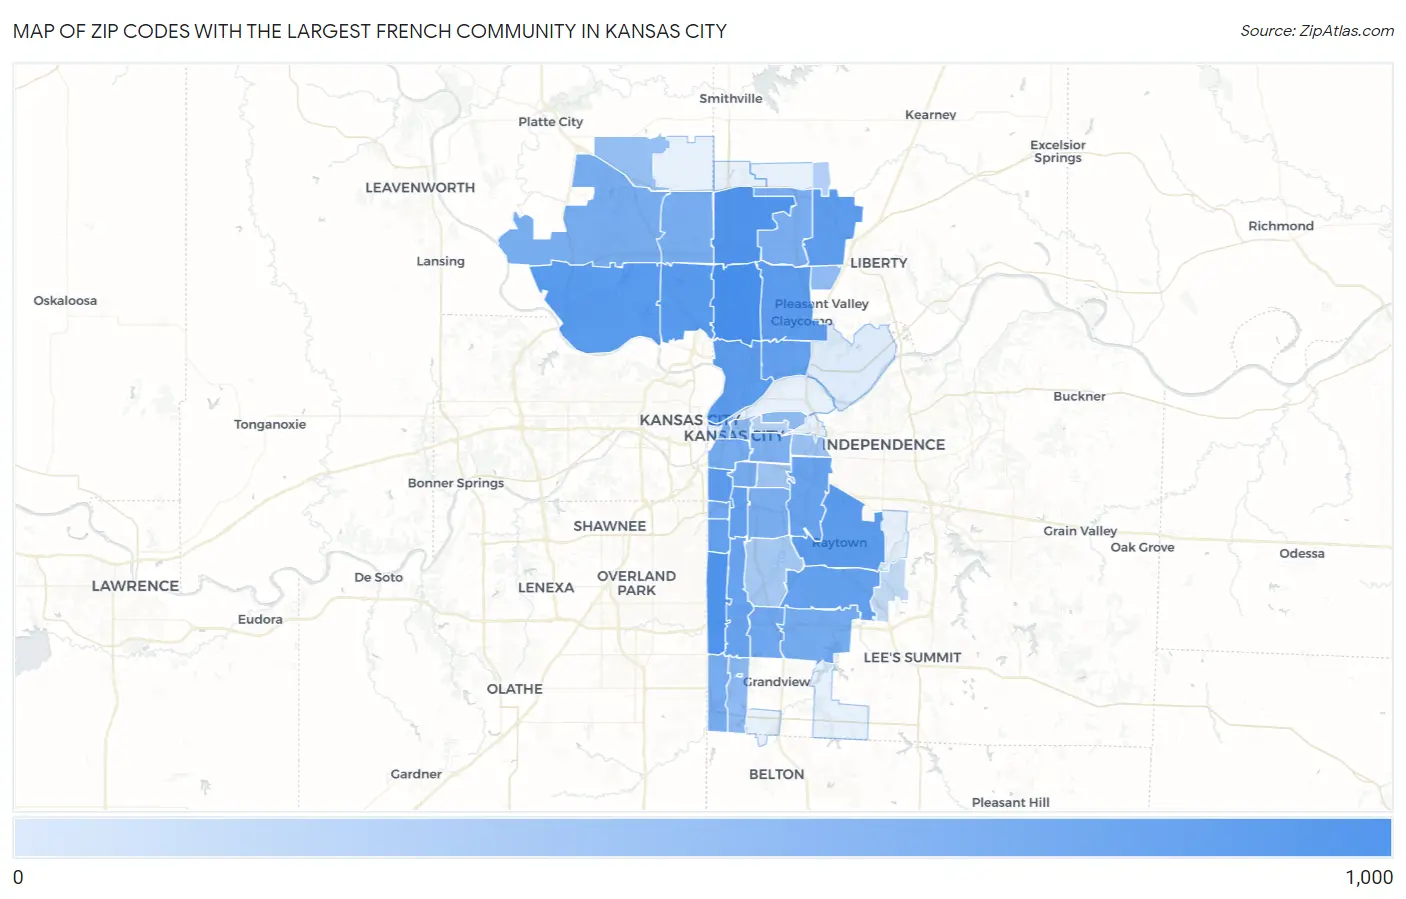
Map of Zip Codes with the Largest French Community in Kansas City

0
1,000
Zip Codes with the Largest French Community in Kansas City Map

Zip Codes with the Largest French Community in Kansas City, MO

Zip Code French vs State vs National
1.64118982149,385(0.66%)#356,841,915(0.01%)#1,390
2.64155713149,385(0.48%)#546,841,915(0.01%)#2,665
3.64114680149,385(0.46%)#606,841,915(0.01%)#2,874
4.64151532149,385(0.36%)#846,841,915(0.01%)#4,061
5.64152514149,385(0.34%)#886,841,915(0.01%)#4,243
6.64111494149,385(0.33%)#946,841,915(0.01%)#4,477
7.64119493149,385(0.33%)#956,841,915(0.01%)#4,484
8.64133451149,385(0.30%)#1066,841,915(0.01%)#4,970
9.64116443149,385(0.30%)#1086,841,915(0.01%)#5,052
10.64157404149,385(0.27%)#1136,841,915(0.01%)#5,536
11.64117351149,385(0.23%)#1246,841,915(0.01%)#6,294
12.64110326149,385(0.22%)#1326,841,915(0.00%)#6,680
13.64113321149,385(0.21%)#1376,841,915(0.00%)#6,787
14.64138307149,385(0.21%)#1466,841,915(0.00%)#6,987
15.64129265149,385(0.18%)#1636,841,915(0.00%)#7,716
16.64131251149,385(0.17%)#1686,841,915(0.00%)#8,003
17.64137190149,385(0.13%)#1956,841,915(0.00%)#9,368
18.64112186149,385(0.12%)#1976,841,915(0.00%)#9,486
19.64134169149,385(0.11%)#2146,841,915(0.00%)#9,960
20.64108169149,385(0.11%)#2156,841,915(0.00%)#9,969
21.64109160149,385(0.11%)#2216,841,915(0.00%)#10,246
22.64153153149,385(0.10%)#2286,841,915(0.00%)#10,469
23.64154149149,385(0.10%)#2326,841,915(0.00%)#10,595
24.64145149149,385(0.10%)#2356,841,915(0.00%)#10,609
25.64156133149,385(0.09%)#2596,841,915(0.00%)#11,197
26.64130129149,385(0.09%)#2626,841,915(0.00%)#11,316
27.64127120149,385(0.08%)#2756,841,915(0.00%)#11,712
28.64105110149,385(0.07%)#2906,841,915(0.00%)#12,196
29.6410661149,385(0.04%)#3596,841,915(0.00%)#15,092
30.6414659149,385(0.04%)#3696,841,915(0.00%)#15,320
31.6412358149,385(0.04%)#3706,841,915(0.00%)#15,338
32.6415855149,385(0.04%)#3796,841,915(0.00%)#15,632
33.6416348149,385(0.03%)#4056,841,915(0.00%)#16,383
34.6412640149,385(0.03%)#4276,841,915(0.00%)#17,228
35.6412829149,385(0.02%)#4776,841,915(0.00%)#18,765
36.6413223149,385(0.02%)#5156,841,915(0.00%)#19,798
37.6416716149,385(0.01%)#5836,841,915(0.00%)#21,481
38.6412412149,385(0.01%)#6156,841,915(0.00%)#22,376
39.641397149,385(0.00%)#6866,841,915(0.00%)#24,070
40.641612149,385(0.00%)#7966,841,915(0.00%)#26,352

Common Questions

What are the Top 10 Zip Codes with the Largest French Community in Kansas City, MO?
Top 10 Zip Codes with the Largest French Community in Kansas City, MO are:
#1
982
#2
713
#3
680
#4
532
#5
514
#6
494
#7
493
#8
451
#9
443
#10
404
What zip code has the Largest French Community in Kansas City, MO?
64118 has the Largest French Community in Kansas City, MO with 982.
What is the Total French Population in Kansas City, MO?
Total French Population in Kansas City is 7,889.
What is the Total French Population in Missouri?
Total French Population in Missouri is 149,385.
What is the Total French Population in the United States?
Total French Population in the United States is 6,841,915.