Zip Codes with the Highest Percentage of Population Employed in Security & Protection in O Fallon, MO
RELATED REPORTS & OPTIONS
Security & Protection
O Fallon
Compare Zip Codes
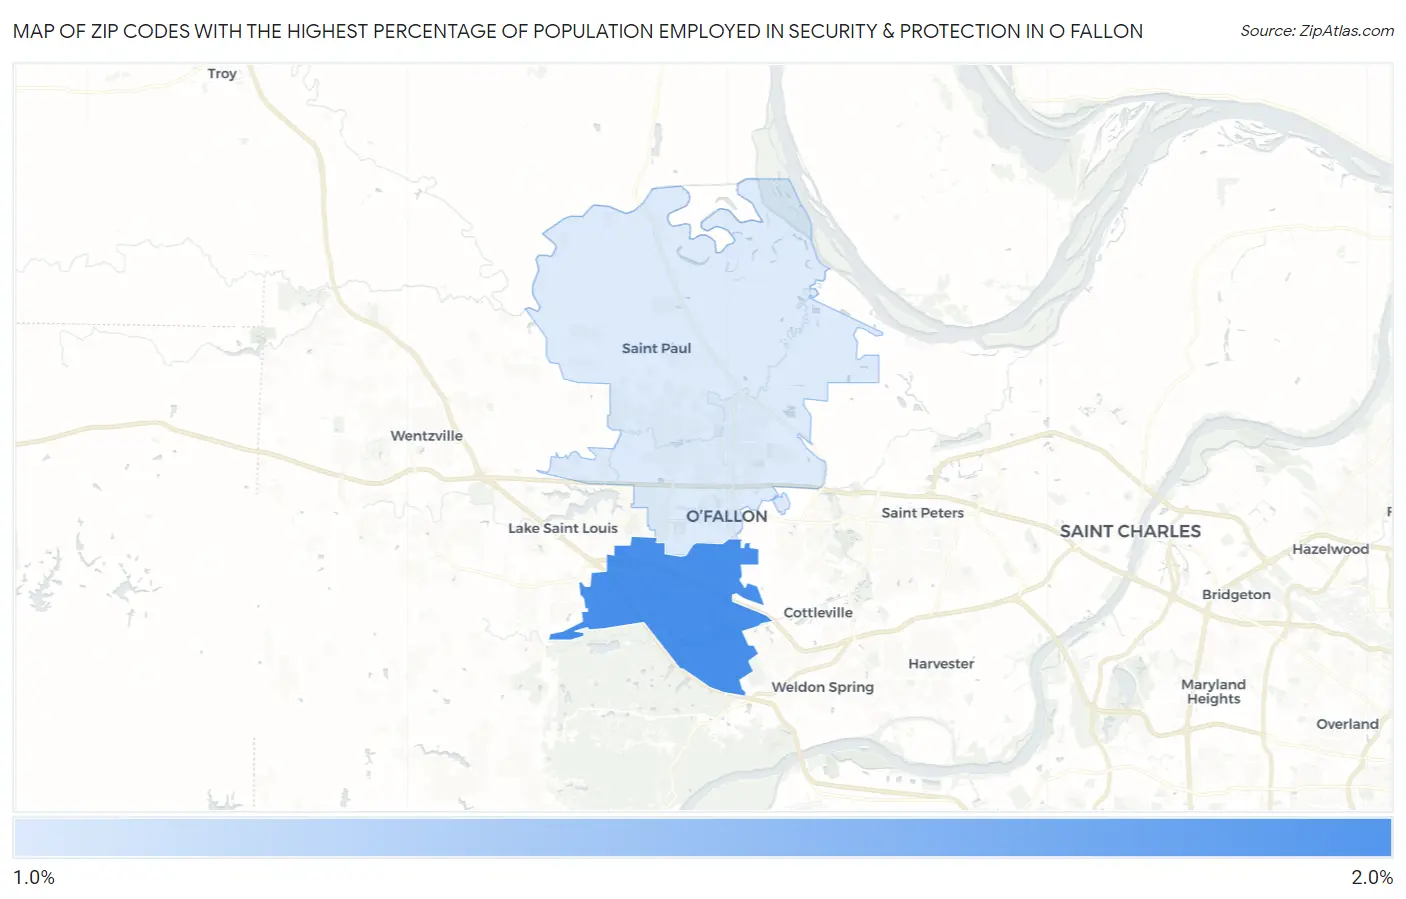
Map of Zip Codes with the Highest Percentage of Population Employed in Security & Protection in O Fallon
1.5%
1.9%
Zip Codes with the Highest Percentage of Population Employed in Security & Protection in O Fallon, MO
| Zip Code | % Employed | vs State | vs National | |
| 1. | 63368 | 1.9% | 1.9%(-0.013)#329 | 2.1%(-0.270)#13,386 |
| 2. | 63366 | 1.5% | 1.9%(-0.346)#399 | 2.1%(-0.603)#15,834 |
1
Common Questions
What are the Top Zip Codes with the Highest Percentage of Population Employed in Security & Protection in O Fallon, MO?
Top Zip Codes with the Highest Percentage of Population Employed in Security & Protection in O Fallon, MO are:
What zip code has the Highest Percentage of Population Employed in Security & Protection in O Fallon, MO?
63368 has the Highest Percentage of Population Employed in Security & Protection in O Fallon, MO with 1.9%.
What is the Percentage of Population Employed in Security & Protection in O Fallon, MO?
Percentage of Population Employed in Security & Protection in O Fallon is 1.8%.
What is the Percentage of Population Employed in Security & Protection in Missouri?
Percentage of Population Employed in Security & Protection in Missouri is 1.9%.
What is the Percentage of Population Employed in Security & Protection in the United States?
Percentage of Population Employed in Security & Protection in the United States is 2.1%.