Zip Codes with the Highest Percentage of Population Employed in Education Instruction & Library in Kansas City, MO

RELATED REPORTS & OPTIONS

Education Instruction & Library
Population
Families and Households
Female Fertility
Female Fertility (Unmarried)
Race (Community Size)
Race (Percentage)
Ancestry (Community Size)
AfghanAfricanAlaska NativeAlbanianAmericanApacheArabArgentineanArmenianAustralianAustrianBahamianBangladeshiBelgianBelizeanBhutaneseBlackfeetBolivianBrazilianBritishBulgarianBurmeseCanadianCelticCentral AmericanCentral American IndianCherokeeChickasawChileanChippewaChoctawColombianComancheCosta RicanCreeCreekCroatianCrowCubanCzechCzechoslovakianDanishDominicanDutchDutch West IndianEastern EuropeanEcuadorianEgyptianEnglishEthiopianEuropeanFijianFilipinoFinnishFrenchFrench American IndianFrench CanadianGermanGerman RussianGhanaianGreekGuamanian / ChamorroGuatemalanGuyaneseHaitianHonduranHungarianIcelanderIndian (Asian)IndonesianIranianIraqiIrishIroquoisIsraeliItalianJamaicanJapaneseJordanianKenyanKoreanLaotianLatvianLebaneseLiberianLithuanianLuxembourgerMalaysianMexicanMexican American IndianMongolianMoroccanNative HawaiianNavajoNew ZealanderNicaraguanNigerianNorthern EuropeanNorwegianOsageOttawaPakistaniPalestinianPanamanianPennsylvania GermanPeruvianPolishPortuguesePotawatomiPuebloPuerto RicanRomanianRussianSalvadoranSamoanScandinavianScotch-IrishScottishSeminoleSerbianShoshoneSierra LeoneanSiouxSlavicSlovakSloveneSomaliSouth AfricanSouth AmericanSouth American IndianSpaniardSpanishSri LankanSubsaharan AfricanSudaneseSwedishSwissSyrianThaiTrinidadian and TobagonianTurkishUgandanUkrainianUruguayanVenezuelanVietnameseWelshWest IndianYugoslavian
Ancestry (Percentage)
AfghanAfricanAlaska NativeAlbanianAmericanApacheArabArgentineanArmenianAustralianAustrianBahamianBangladeshiBelgianBelizeanBhutaneseBlackfeetBolivianBrazilianBritishBulgarianBurmeseCanadianCelticCentral AmericanCentral American IndianCherokeeChickasawChileanChippewaChoctawColombianComancheCosta RicanCreeCreekCroatianCrowCubanCzechCzechoslovakianDanishDominicanDutchDutch West IndianEastern EuropeanEcuadorianEgyptianEnglishEthiopianEuropeanFijianFilipinoFinnishFrenchFrench American IndianFrench CanadianGermanGerman RussianGhanaianGreekGuamanian / ChamorroGuatemalanGuyaneseHaitianHonduranHungarianIcelanderIndian (Asian)IndonesianIranianIraqiIrishIroquoisIsraeliItalianJamaicanJapaneseJordanianKenyanKoreanLaotianLatvianLebaneseLiberianLithuanianLuxembourgerMalaysianMexicanMexican American IndianMongolianMoroccanNative HawaiianNavajoNew ZealanderNicaraguanNigerianNorthern EuropeanNorwegianOsageOttawaPakistaniPalestinianPanamanianPennsylvania GermanPeruvianPolishPortuguesePotawatomiPuebloPuerto RicanRomanianRussianSalvadoranSamoanScandinavianScotch-IrishScottishSeminoleSerbianShoshoneSierra LeoneanSiouxSlavicSlovakSloveneSomaliSouth AfricanSouth AmericanSouth American IndianSpaniardSpanishSri LankanSubsaharan AfricanSudaneseSwedishSwissSyrianThaiTrinidadian and TobagonianTurkishUgandanUkrainianUruguayanVenezuelanVietnameseWelshWest IndianYugoslavian
Immigrant Origin (Total)
AfghanistanAfricaArgentinaAsiaAustraliaBahamasBangladeshBelarusBelgiumBelizeBoliviaBosnia and HerzegovinaBrazilBulgariaBurma / MyanmarCambodiaCameroonCanadaCaribbeanCentral AmericaChileChinaColombiaCongoCosta RicaCubaCzechoslovakiaDenmarkDominican RepublicEastern AfricaEastern AsiaEastern EuropeEcuadorEgyptEl SalvadorEnglandEritreaEthiopiaEuropeFijiFranceGermanyGhanaGreeceGuatemalaGuyanaHaitiHondurasHong KongHungaryIndiaIndonesiaIranIraqIrelandIsraelItalyJamaicaJapanJordanKazakhstanKenyaKoreaKuwaitLaosLatin AmericaLebanonLiberiaMalaysiaMexicoMicronesiaMiddle AfricaMoroccoNepalNetherlandsNicaraguaNigeriaNorthern AfricaNorthern EuropeOceaniaPakistanPeruPhilippinesPolandPortugalRomaniaRussiaSaudi ArabiaScotlandSierra LeoneSomaliaSouth AfricaSouth AmericaSouth Central AsiaSouth Eastern AsiaSouthern EuropeSpainSri LankaSudanSwedenSwitzerlandSyriaTaiwanThailandTrinidad and TobagoTurkeyUgandaUkraineUruguayVenezuelaVietnamWestern AfricaWestern AsiaWestern EuropeZaireZimbabwe
Immigrant Origin (Percentage)
AfghanistanAfricaArgentinaAsiaAustraliaBahamasBangladeshBelarusBelgiumBelizeBoliviaBosnia and HerzegovinaBrazilBulgariaBurma / MyanmarCambodiaCameroonCanadaCaribbeanCentral AmericaChileChinaColombiaCongoCosta RicaCubaCzechoslovakiaDenmarkDominican RepublicEastern AfricaEastern AsiaEastern EuropeEcuadorEgyptEl SalvadorEnglandEritreaEthiopiaEuropeFijiFranceGermanyGhanaGreeceGuatemalaGuyanaHaitiHondurasHong KongHungaryIndiaIndonesiaIranIraqIrelandIsraelItalyJamaicaJapanJordanKazakhstanKenyaKoreaKuwaitLaosLatin AmericaLebanonLiberiaMalaysiaMexicoMicronesiaMiddle AfricaMoroccoNepalNetherlandsNicaraguaNigeriaNorthern AfricaNorthern EuropeOceaniaPakistanPeruPhilippinesPolandPortugalRomaniaRussiaSaudi ArabiaScotlandSierra LeoneSomaliaSouth AfricaSouth AmericaSouth Central AsiaSouth Eastern AsiaSouthern EuropeSpainSri LankaSudanSwedenSwitzerlandSyriaTaiwanThailandTrinidad and TobagoTurkeyUgandaUkraineUruguayVenezuelaVietnamWestern AfricaWestern AsiaWestern EuropeZaireZimbabwe
Income
Income (Families)
Income (Households)
Poverty
Poverty (Families)
Unemployment
Employment Occupations
Employment Industries
Employer Class
Commute Time
Commute Means
School Enrollment
Education by Degree Field
Occupancy
Finances
Physical Characteristics
Kansas City
Compare Zip Codes
Comparison Subject

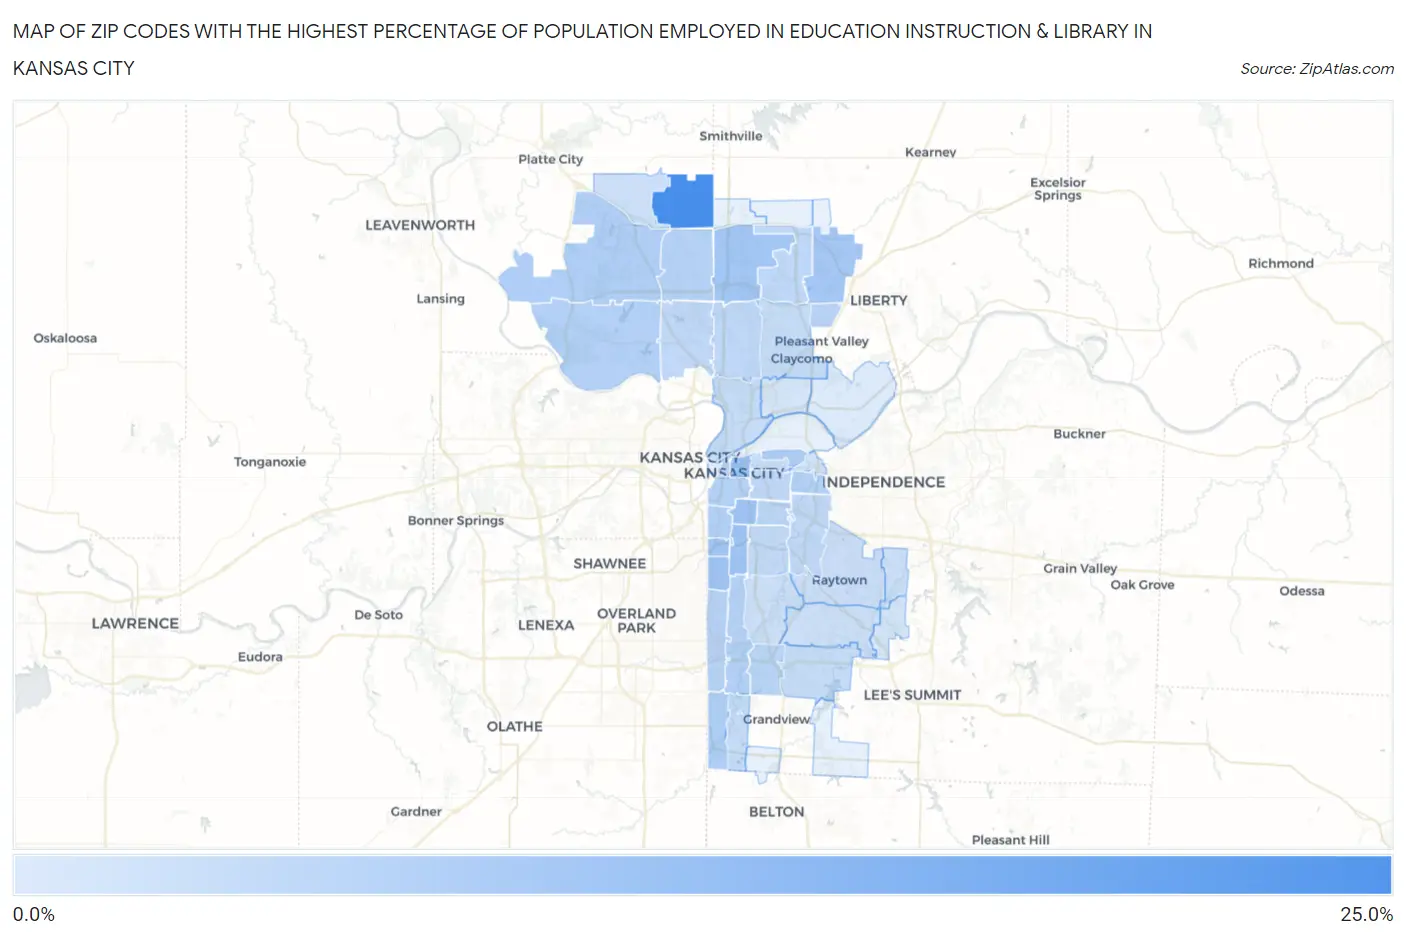
Map of Zip Codes with the Highest Percentage of Population Employed in Education Instruction & Library in Kansas City

0.0%
25.0%
Zip Codes with the Highest Percentage of Population Employed in Education Instruction & Library in Kansas City Map

Zip Codes with the Highest Percentage of Population Employed in Education Instruction & Library in Kansas City, MO

Zip Code % Employed vs State vs National
1.6416421.1%6.1%(+14.9)#186.2%(+14.9)#569
2.641068.6%6.1%(+2.47)#1716.2%(+2.40)#5,960
3.641098.5%6.1%(+2.36)#1746.2%(+2.29)#6,150
4.641108.5%6.1%(+2.34)#1756.2%(+2.27)#6,173
5.641138.3%6.1%(+2.16)#1856.2%(+2.09)#6,576
6.641558.1%6.1%(+1.99)#1956.2%(+1.92)#6,934
7.641128.1%6.1%(+1.96)#1976.2%(+1.89)#6,995
8.641577.8%6.1%(+1.66)#2126.2%(+1.59)#7,701
9.641236.7%6.1%(+0.579)#3066.2%(+0.508)#10,933
10.641456.4%6.1%(+0.302)#3396.2%(+0.231)#11,919
11.641536.4%6.1%(+0.296)#3436.2%(+0.225)#11,945
12.641115.9%6.1%(-0.211)#4006.2%(-0.281)#13,876
13.641525.9%6.1%(-0.254)#4056.2%(-0.325)#14,069
14.641085.7%6.1%(-0.375)#4166.2%(-0.445)#14,579
15.641545.6%6.1%(-0.497)#4336.2%(-0.567)#15,096
16.641315.6%6.1%(-0.558)#4406.2%(-0.628)#15,336
17.641265.5%6.1%(-0.574)#4426.2%(-0.644)#15,396
18.641585.5%6.1%(-0.627)#4466.2%(-0.698)#15,612
19.641145.3%6.1%(-0.795)#4676.2%(-0.866)#16,312
20.641375.2%6.1%(-0.931)#4816.2%(-1.00)#16,854
21.641054.8%6.1%(-1.33)#5246.2%(-1.40)#18,551
22.641284.6%6.1%(-1.46)#5376.2%(-1.53)#19,129
23.641184.6%6.1%(-1.53)#5496.2%(-1.60)#19,417
24.641564.4%6.1%(-1.70)#5636.2%(-1.77)#20,096
25.641274.2%6.1%(-1.89)#5846.2%(-1.96)#20,801
26.641294.1%6.1%(-2.02)#6016.2%(-2.09)#21,310
27.641514.1%6.1%(-2.05)#6076.2%(-2.12)#21,459
28.641303.8%6.1%(-2.29)#6266.2%(-2.36)#22,309
29.641343.7%6.1%(-2.40)#6386.2%(-2.47)#22,682
30.641193.6%6.1%(-2.52)#6486.2%(-2.59)#23,064
31.641163.6%6.1%(-2.55)#6516.2%(-2.62)#23,179
32.641463.5%6.1%(-2.57)#6536.2%(-2.64)#23,231
33.641243.1%6.1%(-2.97)#6876.2%(-3.04)#24,488
34.641333.0%6.1%(-3.08)#6906.2%(-3.15)#24,762
35.641382.8%6.1%(-3.28)#7066.2%(-3.35)#25,221
36.641632.8%6.1%(-3.29)#7086.2%(-3.36)#25,236
37.641322.6%6.1%(-3.49)#7296.2%(-3.56)#25,729
38.641362.6%6.1%(-3.49)#7306.2%(-3.56)#25,733
39.641252.1%6.1%(-4.03)#7746.2%(-4.10)#26,802
40.641171.7%6.1%(-4.40)#8046.2%(-4.47)#27,374
41.641391.5%6.1%(-4.62)#8176.2%(-4.69)#27,671
42.641610.71%6.1%(-5.40)#8556.2%(-5.47)#28,472

Common Questions

What are the Top 10 Zip Codes with the Highest Percentage of Population Employed in Education Instruction & Library in Kansas City, MO?
Top 10 Zip Codes with the Highest Percentage of Population Employed in Education Instruction & Library in Kansas City, MO are:
#1
21.1%
#2
8.6%
#3
8.5%
#4
8.5%
#5
8.3%
#6
8.1%
#7
8.1%
#8
7.8%
#9
6.7%
#10
6.4%
What zip code has the Highest Percentage of Population Employed in Education Instruction & Library in Kansas City, MO?
64164 has the Highest Percentage of Population Employed in Education Instruction & Library in Kansas City, MO with 21.1%.
What is the Percentage of Population Employed in Education Instruction & Library in Kansas City, MO?
Percentage of Population Employed in Education Instruction & Library in Kansas City is 5.3%.
What is the Percentage of Population Employed in Education Instruction & Library in Missouri?
Percentage of Population Employed in Education Instruction & Library in Missouri is 6.1%.
What is the Percentage of Population Employed in Education Instruction & Library in the United States?
Percentage of Population Employed in Education Instruction & Library in the United States is 6.2%.