Zip Codes with the Highest Percentage of Self-Employed / Not Incorporated in Saint Paul, MN

RELATED REPORTS & OPTIONS

Self-Employed / Not Incorporated
Population
Families and Households
Female Fertility
Female Fertility (Unmarried)
Race (Community Size)
Race (Percentage)
Ancestry (Community Size)
AfghanAfricanAlbanianAlsatianAmericanApacheArabArgentineanArmenianAustralianAustrianBahamianBangladeshiBarbadianBelgianBelizeanBhutaneseBlackfeetBrazilianBritishBritish West IndianBulgarianBurmeseCambodianCanadianCarpatho RusynCelticCentral AmericanCentral American IndianCherokeeChickasawChileanChippewaChoctawColombianCosta RicanCreeCroatianCubanCzechCzechoslovakianDanishDominicanDutchEastern EuropeanEcuadorianEgyptianEnglishEstonianEthiopianEuropeanFilipinoFinnishFrenchFrench American IndianFrench CanadianGermanGerman RussianGhanaianGreekGuamanian / ChamorroGuatemalanGuyaneseHaitianHonduranHopiHungarianIcelanderIndian (Asian)IndonesianInupiatIranianIraqiIrishIroquoisIsraeliItalianJamaicanJapaneseJordanianKenyanKoreanLaotianLatvianLebaneseLiberianLithuanianLuxembourgerMacedonianMalaysianMalteseMenomineeMexicanMexican American IndianMongolianMoroccanNative HawaiianNavajoNew ZealanderNicaraguanNigerianNorthern EuropeanNorwegianPakistaniPalestinianPanamanianParaguayanPennsylvania GermanPeruvianPolishPortuguesePotawatomiPuerto RicanPuget Sound SalishRomanianRussianSalvadoranSamoanScandinavianScotch-IrishScottishSeminoleSerbianSiouxSlavicSlovakSloveneSomaliSouth AfricanSouth AmericanSouth American IndianSpaniardSpanishSpanish AmericanSri LankanSubsaharan AfricanSudaneseSwedishSwissSyrianThaiTrinidadian and TobagonianTurkishU.S. Virgin IslanderUgandanUkrainianUruguayanVenezuelanVietnameseWelshWest IndianYugoslavianZimbabwean
Ancestry (Percentage)
AfghanAfricanAlbanianAlsatianAmericanApacheArabArgentineanArmenianAustralianAustrianBahamianBangladeshiBarbadianBelgianBelizeanBhutaneseBlackfeetBrazilianBritishBritish West IndianBulgarianBurmeseCambodianCanadianCarpatho RusynCelticCentral AmericanCentral American IndianCherokeeChickasawChileanChippewaChoctawColombianCosta RicanCreeCroatianCubanCzechCzechoslovakianDanishDominicanDutchEastern EuropeanEcuadorianEgyptianEnglishEstonianEthiopianEuropeanFilipinoFinnishFrenchFrench American IndianFrench CanadianGermanGerman RussianGhanaianGreekGuamanian / ChamorroGuatemalanGuyaneseHaitianHonduranHopiHungarianIcelanderIndian (Asian)IndonesianInupiatIranianIraqiIrishIroquoisIsraeliItalianJamaicanJapaneseJordanianKenyanKoreanLaotianLatvianLebaneseLiberianLithuanianLuxembourgerMacedonianMalaysianMalteseMenomineeMexicanMexican American IndianMongolianMoroccanNative HawaiianNavajoNew ZealanderNicaraguanNigerianNorthern EuropeanNorwegianPakistaniPalestinianPanamanianParaguayanPennsylvania GermanPeruvianPolishPortuguesePotawatomiPuerto RicanPuget Sound SalishRomanianRussianSalvadoranSamoanScandinavianScotch-IrishScottishSeminoleSerbianSiouxSlavicSlovakSloveneSomaliSouth AfricanSouth AmericanSouth American IndianSpaniardSpanishSpanish AmericanSri LankanSubsaharan AfricanSudaneseSwedishSwissSyrianThaiTrinidadian and TobagonianTurkishU.S. Virgin IslanderUgandanUkrainianUruguayanVenezuelanVietnameseWelshWest IndianYugoslavianZimbabwean
Immigrant Origin (Total)
AfghanistanAfricaArgentinaArmeniaAsiaAustraliaAustriaBahamasBangladeshBarbadosBelarusBelgiumBelizeBoliviaBosnia and HerzegovinaBrazilBulgariaBurma / MyanmarCambodiaCameroonCanadaCaribbeanCentral AmericaChileChinaColombiaCongoCosta RicaCroatiaCubaCzechoslovakiaDenmarkDominican RepublicEastern AfricaEastern AsiaEastern EuropeEcuadorEgyptEl SalvadorEnglandEritreaEthiopiaEuropeFranceGermanyGhanaGreeceGuatemalaGuyanaHaitiHondurasHong KongHungaryIndiaIndonesiaIranIraqIrelandIsraelItalyJamaicaJapanJordanKazakhstanKenyaKoreaKuwaitLaosLatin AmericaLatviaLebanonLiberiaMalaysiaMexicoMiddle AfricaMoldovaMoroccoNepalNetherlandsNicaraguaNigeriaNorth MacedoniaNorthern AfricaNorthern EuropeNorwayOceaniaPakistanPanamaPeruPhilippinesPolandPortugalRomaniaRussiaSaudi ArabiaScotlandSerbiaSierra LeoneSingaporeSomaliaSouth AfricaSouth AmericaSouth Central AsiaSouth Eastern AsiaSouthern EuropeSpainSri LankaSudanSwedenSwitzerlandTaiwanThailandTrinidad and TobagoTurkeyUgandaUkraineUruguayVenezuelaVietnamWestern AfricaWestern AsiaWestern EuropeYemenZaireZimbabwe
Immigrant Origin (Percentage)
AfghanistanAfricaArgentinaArmeniaAsiaAustraliaAustriaBahamasBangladeshBarbadosBelarusBelgiumBelizeBoliviaBosnia and HerzegovinaBrazilBulgariaBurma / MyanmarCambodiaCameroonCanadaCaribbeanCentral AmericaChileChinaColombiaCongoCosta RicaCroatiaCubaCzechoslovakiaDenmarkDominican RepublicEastern AfricaEastern AsiaEastern EuropeEcuadorEgyptEl SalvadorEnglandEritreaEthiopiaEuropeFranceGermanyGhanaGreeceGuatemalaGuyanaHaitiHondurasHong KongHungaryIndiaIndonesiaIranIraqIrelandIsraelItalyJamaicaJapanJordanKazakhstanKenyaKoreaKuwaitLaosLatin AmericaLatviaLebanonLiberiaMalaysiaMexicoMiddle AfricaMoldovaMoroccoNepalNetherlandsNicaraguaNigeriaNorth MacedoniaNorthern AfricaNorthern EuropeNorwayOceaniaPakistanPanamaPeruPhilippinesPolandPortugalRomaniaRussiaSaudi ArabiaScotlandSerbiaSierra LeoneSingaporeSomaliaSouth AfricaSouth AmericaSouth Central AsiaSouth Eastern AsiaSouthern EuropeSpainSri LankaSudanSwedenSwitzerlandTaiwanThailandTrinidad and TobagoTurkeyUgandaUkraineUruguayVenezuelaVietnamWestern AfricaWestern AsiaWestern EuropeYemenZaireZimbabwe
Income
Income (Families)
Income (Households)
Poverty
Poverty (Families)
Unemployment
Employment Occupations
Employment Industries
Employer Class
Commute Time
Commute Means
School Enrollment
Education by Degree Field
Occupancy
Finances
Physical Characteristics
Saint Paul
Compare Zip Codes
Comparison Subject

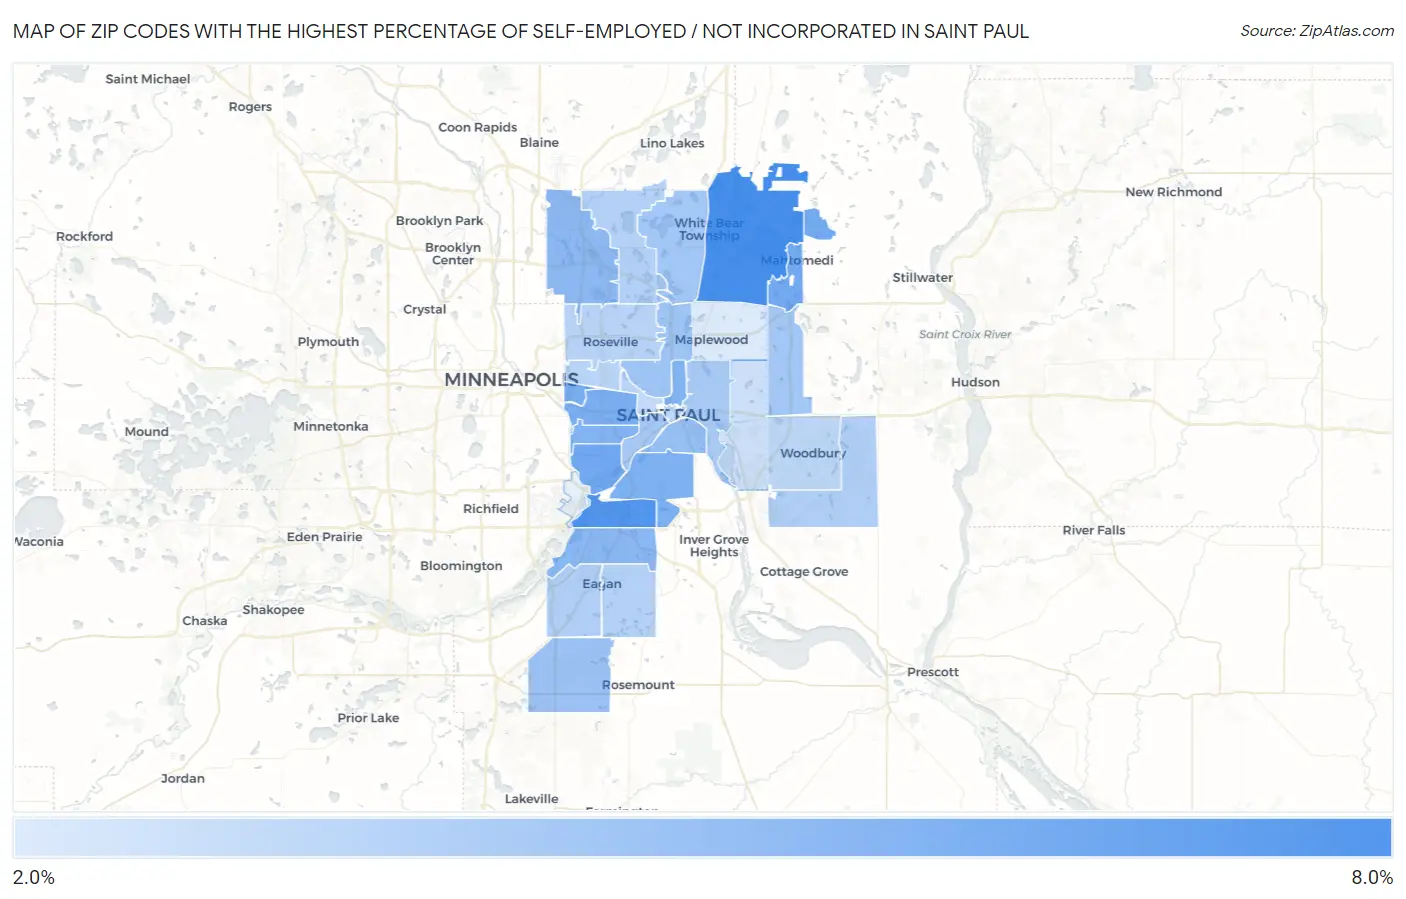
Map of Zip Codes with the Highest Percentage of Self-Employed / Not Incorporated in Saint Paul

0.0%
8.0%
Zip Codes with the Highest Percentage of Self-Employed / Not Incorporated in Saint Paul Map

Zip Codes with the Highest Percentage of Self-Employed / Not Incorporated in Saint Paul, MN

Zip Code % Self-Employed / Not Incorporated vs State vs National
1.551106.4%5.2%(+1.20)#5155.8%(+0.585)#14,783
2.551206.1%5.2%(+0.880)#5415.8%(+0.260)#15,810
3.551165.2%5.2%(+0.024)#6095.8%(-0.596)#18,841
4.551155.1%5.2%(-0.061)#6155.8%(-0.681)#19,166
5.551145.0%5.2%(-0.182)#6245.8%(-0.801)#19,619
6.551044.9%5.2%(-0.249)#6285.8%(-0.869)#19,862
7.551184.8%5.2%(-0.418)#6415.8%(-1.04)#20,506
8.551054.8%5.2%(-0.445)#6485.8%(-1.06)#20,610
9.551304.7%5.2%(-0.463)#6505.8%(-1.08)#20,674
10.551214.5%5.2%(-0.744)#6755.8%(-1.36)#21,780
11.551124.4%5.2%(-0.813)#6805.8%(-1.43)#22,021
12.551074.1%5.2%(-1.10)#7065.8%(-1.72)#23,051
13.551244.0%5.2%(-1.22)#7165.8%(-1.84)#23,491
14.551173.9%5.2%(-1.32)#7255.8%(-1.94)#23,819
15.551273.8%5.2%(-1.44)#7385.8%(-2.06)#24,231
16.551283.7%5.2%(-1.49)#7445.8%(-2.11)#24,375
17.551023.7%5.2%(-1.53)#7475.8%(-2.15)#24,516
18.551063.6%5.2%(-1.63)#7585.8%(-2.25)#24,805
19.551223.4%5.2%(-1.84)#7715.8%(-2.46)#25,449
20.551293.3%5.2%(-1.87)#7765.8%(-2.49)#25,521
21.551263.3%5.2%(-1.90)#7785.8%(-2.52)#25,612
22.551233.3%5.2%(-1.91)#7795.8%(-2.53)#25,636
23.551133.2%5.2%(-2.03)#7915.8%(-2.65)#25,961
24.551083.1%5.2%(-2.13)#7945.8%(-2.75)#26,216
25.551253.0%5.2%(-2.20)#7995.8%(-2.82)#26,394
26.551012.9%5.2%(-2.25)#8005.8%(-2.87)#26,510
27.551032.9%5.2%(-2.32)#8045.8%(-2.94)#26,667
28.551192.5%5.2%(-2.68)#8205.8%(-3.30)#27,372
29.551092.1%5.2%(-3.10)#8315.8%(-3.72)#28,102

Common Questions

What are the Top 10 Zip Codes with the Highest Percentage of Self-Employed / Not Incorporated in Saint Paul, MN?
Top 10 Zip Codes with the Highest Percentage of Self-Employed / Not Incorporated in Saint Paul, MN are:
#1
6.4%
#2
6.1%
#3
5.2%
#4
5.1%
#5
5.0%
#6
4.9%
#7
4.8%
#8
4.8%
#9
4.7%
#10
4.5%
What zip code has the Highest Percentage of Self-Employed / Not Incorporated in Saint Paul, MN?
55110 has the Highest Percentage of Self-Employed / Not Incorporated in Saint Paul, MN with 6.4%.
What is the Percentage of Self-Employed / Not Incorporated in Minnesota?
Percentage of Self-Employed / Not Incorporated in Minnesota is 5.2%.
What is the Percentage of Self-Employed / Not Incorporated in the United States?
Percentage of Self-Employed / Not Incorporated in the United States is 5.8%.