Zip Codes with the Highest Percentage of Population Employed in Business & Financial in Sterling Heights, MI
RELATED REPORTS & OPTIONS
Business & Financial
Sterling Heights
Compare Zip Codes
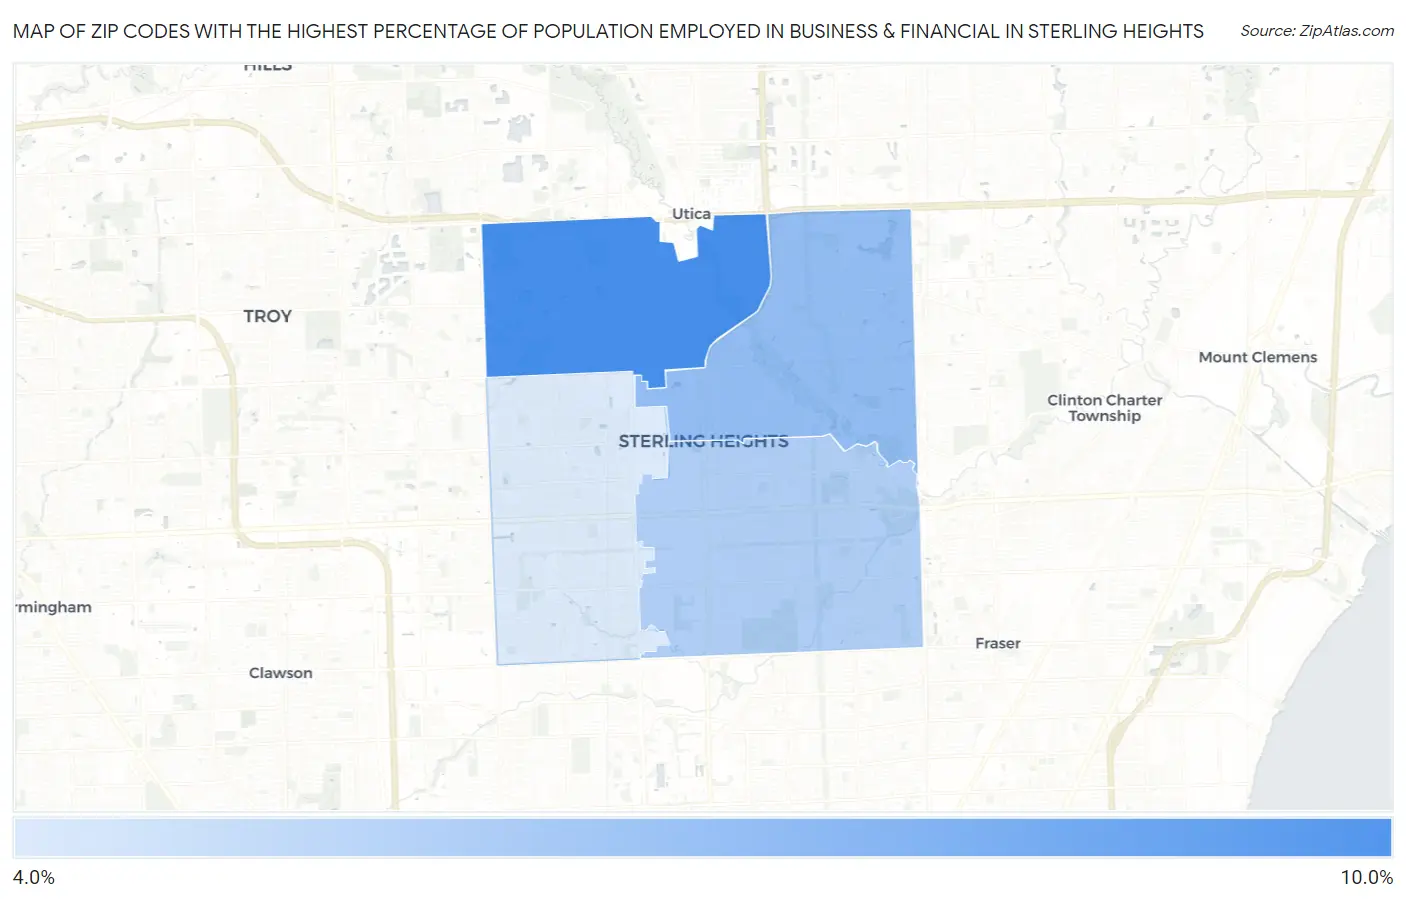
Map of Zip Codes with the Highest Percentage of Population Employed in Business & Financial in Sterling Heights
4.8%
8.7%
Zip Codes with the Highest Percentage of Population Employed in Business & Financial in Sterling Heights, MI
| Zip Code | % Employed | vs State | vs National | |
| 1. | 48314 | 8.7% | 5.3%(+3.48)#64 | 5.8%(+2.98)#3,347 |
| 2. | 48313 | 6.7% | 5.3%(+1.43)#165 | 5.8%(+0.933)#6,371 |
| 3. | 48312 | 6.0% | 5.3%(+0.716)#210 | 5.8%(+0.216)#7,884 |
| 4. | 48310 | 4.8% | 5.3%(-0.493)#316 | 5.8%(-0.992)#11,176 |
1
Common Questions
What are the Top 3 Zip Codes with the Highest Percentage of Population Employed in Business & Financial in Sterling Heights, MI?
Top 3 Zip Codes with the Highest Percentage of Population Employed in Business & Financial in Sterling Heights, MI are:
What zip code has the Highest Percentage of Population Employed in Business & Financial in Sterling Heights, MI?
48314 has the Highest Percentage of Population Employed in Business & Financial in Sterling Heights, MI with 8.7%.
What is the Percentage of Population Employed in Business & Financial in Sterling Heights, MI?
Percentage of Population Employed in Business & Financial in Sterling Heights is 6.2%.
What is the Percentage of Population Employed in Business & Financial in Michigan?
Percentage of Population Employed in Business & Financial in Michigan is 5.3%.
What is the Percentage of Population Employed in Business & Financial in the United States?
Percentage of Population Employed in Business & Financial in the United States is 5.8%.