Zip Codes with the Highest Percentage of Population Employed in Administrative & Support Services in Southfield, MI
RELATED REPORTS & OPTIONS
Administrative & Support Services
Southfield
Compare Zip Codes
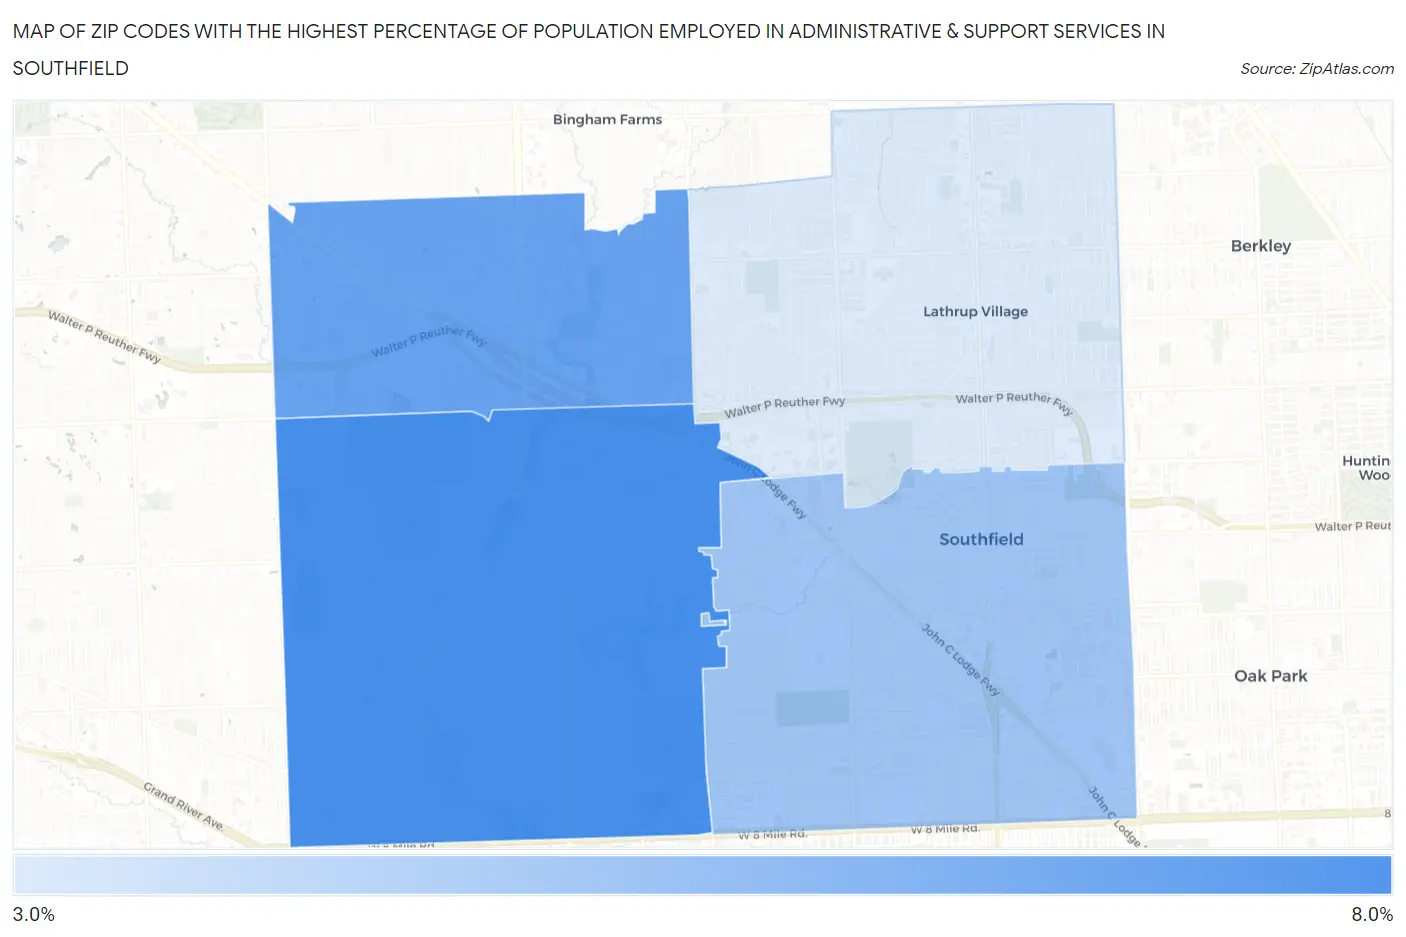
Map of Zip Codes with the Highest Percentage of Population Employed in Administrative & Support Services in Southfield
3.7%
6.1%
Zip Codes with the Highest Percentage of Population Employed in Administrative & Support Services in Southfield, MI
| Zip Code | % Employed | vs State | vs National | |
| 1. | 48033 | 6.1% | 3.7%(+2.38)#109 | 4.1%(+1.96)#4,571 |
| 2. | 48034 | 5.6% | 3.7%(+1.87)#142 | 4.1%(+1.45)#5,598 |
| 3. | 48075 | 4.7% | 3.7%(+0.999)#222 | 4.1%(+0.577)#7,946 |
| 4. | 48076 | 3.7% | 3.7%(+0.016)#359 | 4.1%(-0.407)#11,801 |
1
Common Questions
What are the Top 3 Zip Codes with the Highest Percentage of Population Employed in Administrative & Support Services in Southfield, MI?
Top 3 Zip Codes with the Highest Percentage of Population Employed in Administrative & Support Services in Southfield, MI are:
What zip code has the Highest Percentage of Population Employed in Administrative & Support Services in Southfield, MI?
48033 has the Highest Percentage of Population Employed in Administrative & Support Services in Southfield, MI with 6.1%.
What is the Percentage of Population Employed in Administrative & Support Services in Southfield, MI?
Percentage of Population Employed in Administrative & Support Services in Southfield is 5.0%.
What is the Percentage of Population Employed in Administrative & Support Services in Michigan?
Percentage of Population Employed in Administrative & Support Services in Michigan is 3.7%.
What is the Percentage of Population Employed in Administrative & Support Services in the United States?
Percentage of Population Employed in Administrative & Support Services in the United States is 4.1%.