Zip Codes with the Highest Percentage of Population Employed in Legal Services & Support in Southfield, MI
RELATED REPORTS & OPTIONS
Legal Services & Support
Southfield
Compare Zip Codes
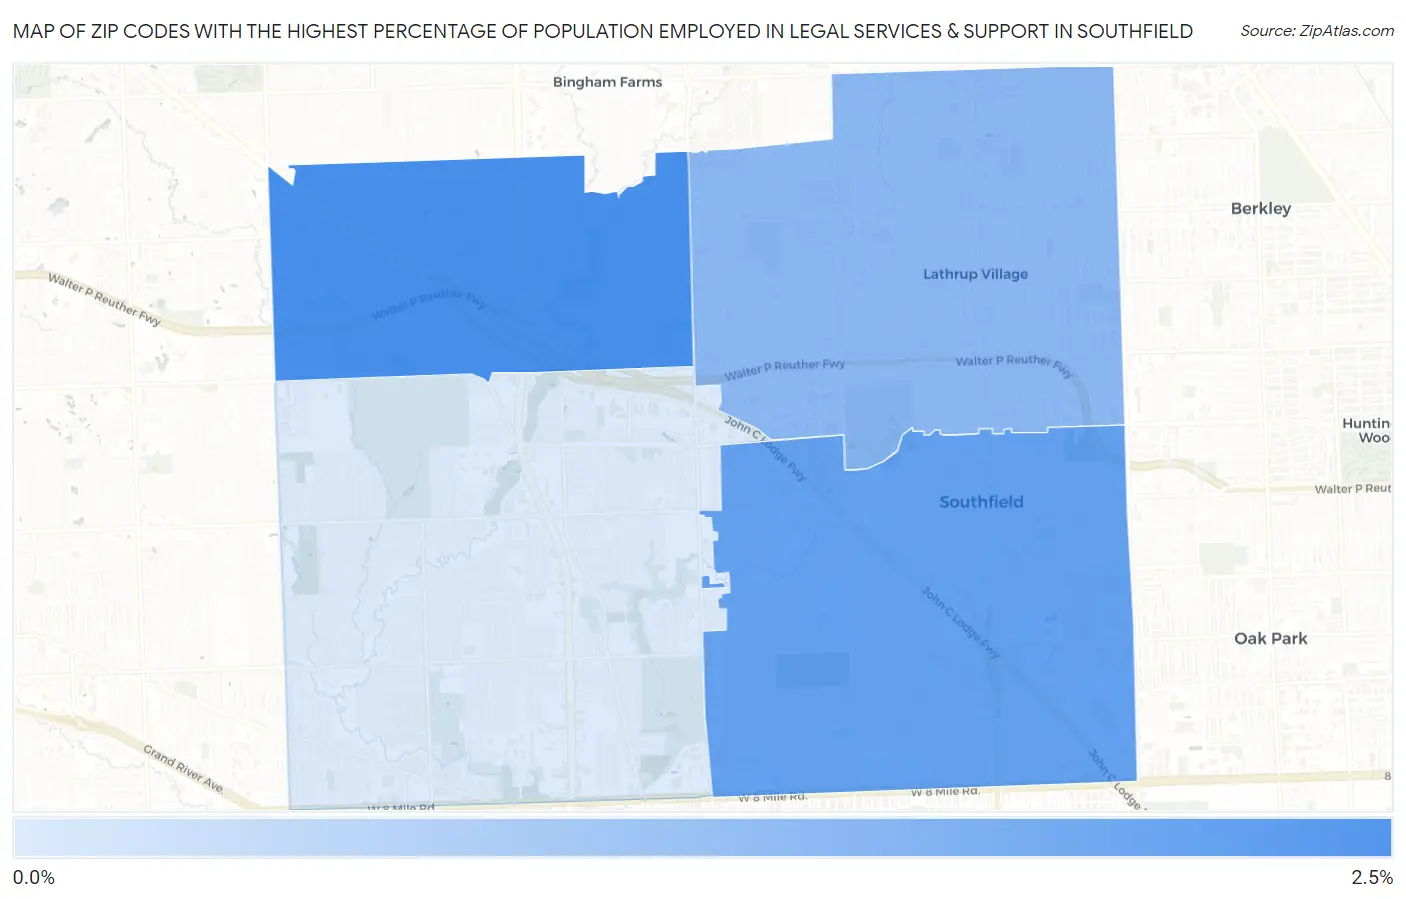
Map of Zip Codes with the Highest Percentage of Population Employed in Legal Services & Support in Southfield
0.48%
2.1%
Zip Codes with the Highest Percentage of Population Employed in Legal Services & Support in Southfield, MI
| Zip Code | % Employed | vs State | vs National | |
| 1. | 48034 | 2.1% | 0.89%(+1.19)#49 | 1.2%(+0.891)#3,276 |
| 2. | 48075 | 1.8% | 0.89%(+0.886)#73 | 1.2%(+0.587)#4,078 |
| 3. | 48076 | 1.4% | 0.89%(+0.467)#123 | 1.2%(+0.169)#5,680 |
| 4. | 48033 | 0.48% | 0.89%(-0.406)#388 | 1.2%(-0.705)#12,898 |
1
Common Questions
What are the Top 3 Zip Codes with the Highest Percentage of Population Employed in Legal Services & Support in Southfield, MI?
Top 3 Zip Codes with the Highest Percentage of Population Employed in Legal Services & Support in Southfield, MI are:
What zip code has the Highest Percentage of Population Employed in Legal Services & Support in Southfield, MI?
48034 has the Highest Percentage of Population Employed in Legal Services & Support in Southfield, MI with 2.1%.
What is the Percentage of Population Employed in Legal Services & Support in Southfield, MI?
Percentage of Population Employed in Legal Services & Support in Southfield is 1.5%.
What is the Percentage of Population Employed in Legal Services & Support in Michigan?
Percentage of Population Employed in Legal Services & Support in Michigan is 0.89%.
What is the Percentage of Population Employed in Legal Services & Support in the United States?
Percentage of Population Employed in Legal Services & Support in the United States is 1.2%.