Zip Codes with the Highest Percentage of Population Employed in Transportation & Warehousing in Livonia, MI
RELATED REPORTS & OPTIONS
Transportation & Warehousing
Livonia
Compare Zip Codes
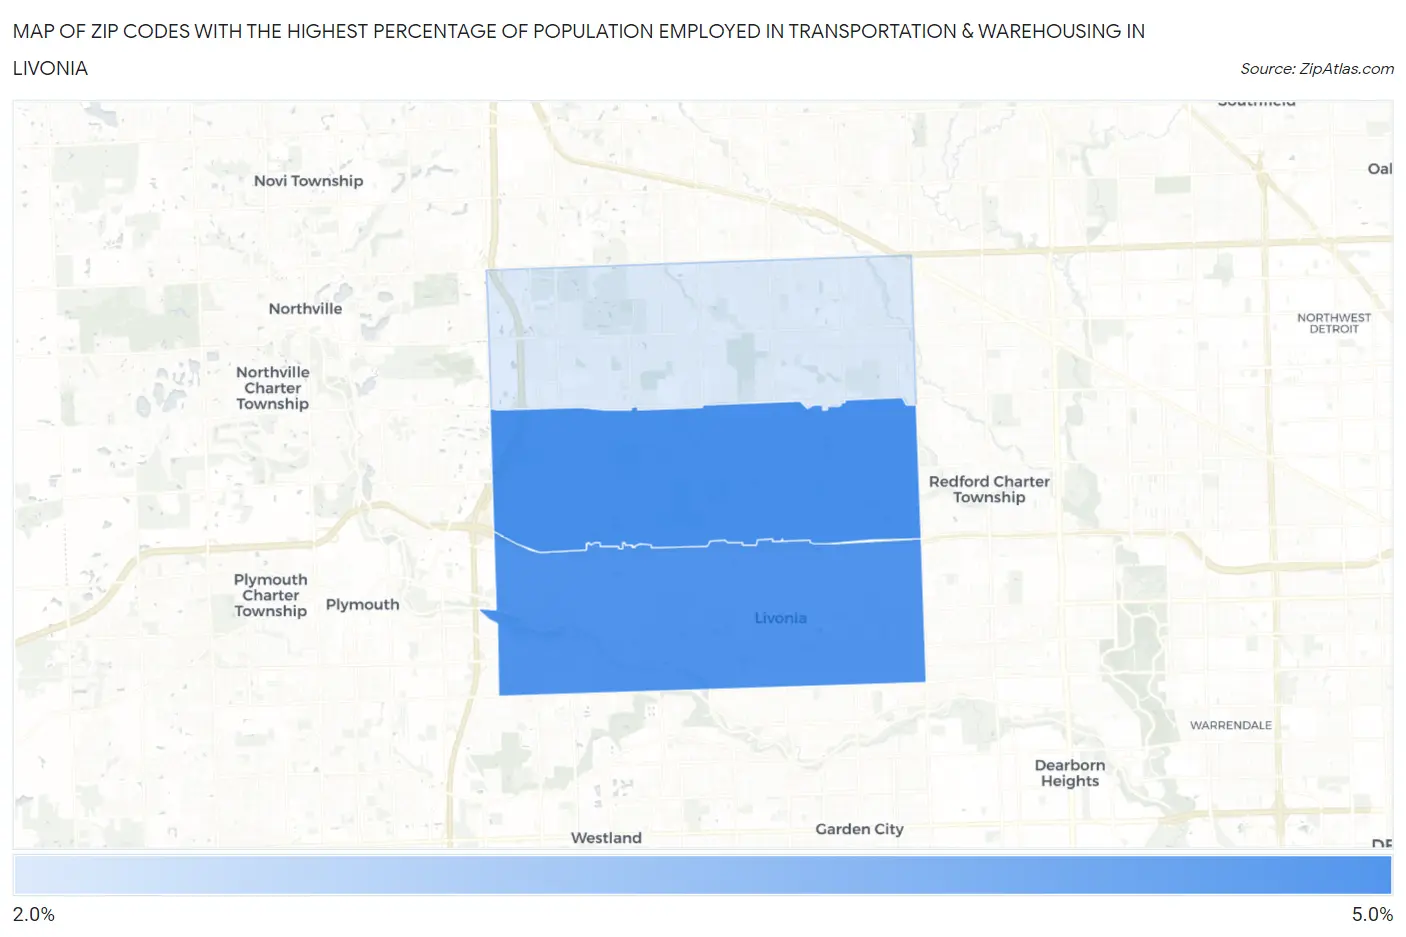
Map of Zip Codes with the Highest Percentage of Population Employed in Transportation & Warehousing in Livonia
2.9%
4.2%
Zip Codes with the Highest Percentage of Population Employed in Transportation & Warehousing in Livonia, MI
| Zip Code | % Employed | vs State | vs National | |
| 1. | 48154 | 4.2% | 3.9%(+0.254)#376 | 4.9%(-0.784)#15,192 |
| 2. | 48150 | 4.1% | 3.9%(+0.185)#385 | 4.9%(-0.854)#15,502 |
| 3. | 48152 | 2.9% | 3.9%(-1.06)#606 | 4.9%(-2.09)#20,901 |
1
Common Questions
What are the Top Zip Codes with the Highest Percentage of Population Employed in Transportation & Warehousing in Livonia, MI?
Top Zip Codes with the Highest Percentage of Population Employed in Transportation & Warehousing in Livonia, MI are:
What zip code has the Highest Percentage of Population Employed in Transportation & Warehousing in Livonia, MI?
48154 has the Highest Percentage of Population Employed in Transportation & Warehousing in Livonia, MI with 4.2%.
What is the Percentage of Population Employed in Transportation & Warehousing in Livonia, MI?
Percentage of Population Employed in Transportation & Warehousing in Livonia is 3.7%.
What is the Percentage of Population Employed in Transportation & Warehousing in Michigan?
Percentage of Population Employed in Transportation & Warehousing in Michigan is 3.9%.
What is the Percentage of Population Employed in Transportation & Warehousing in the United States?
Percentage of Population Employed in Transportation & Warehousing in the United States is 4.9%.