Zip Codes with the Highest Percentage of Population Employed in Computer & Mathematics in Danville, IL
RELATED REPORTS & OPTIONS
Computer & Mathematics
Danville
Compare Zip Codes
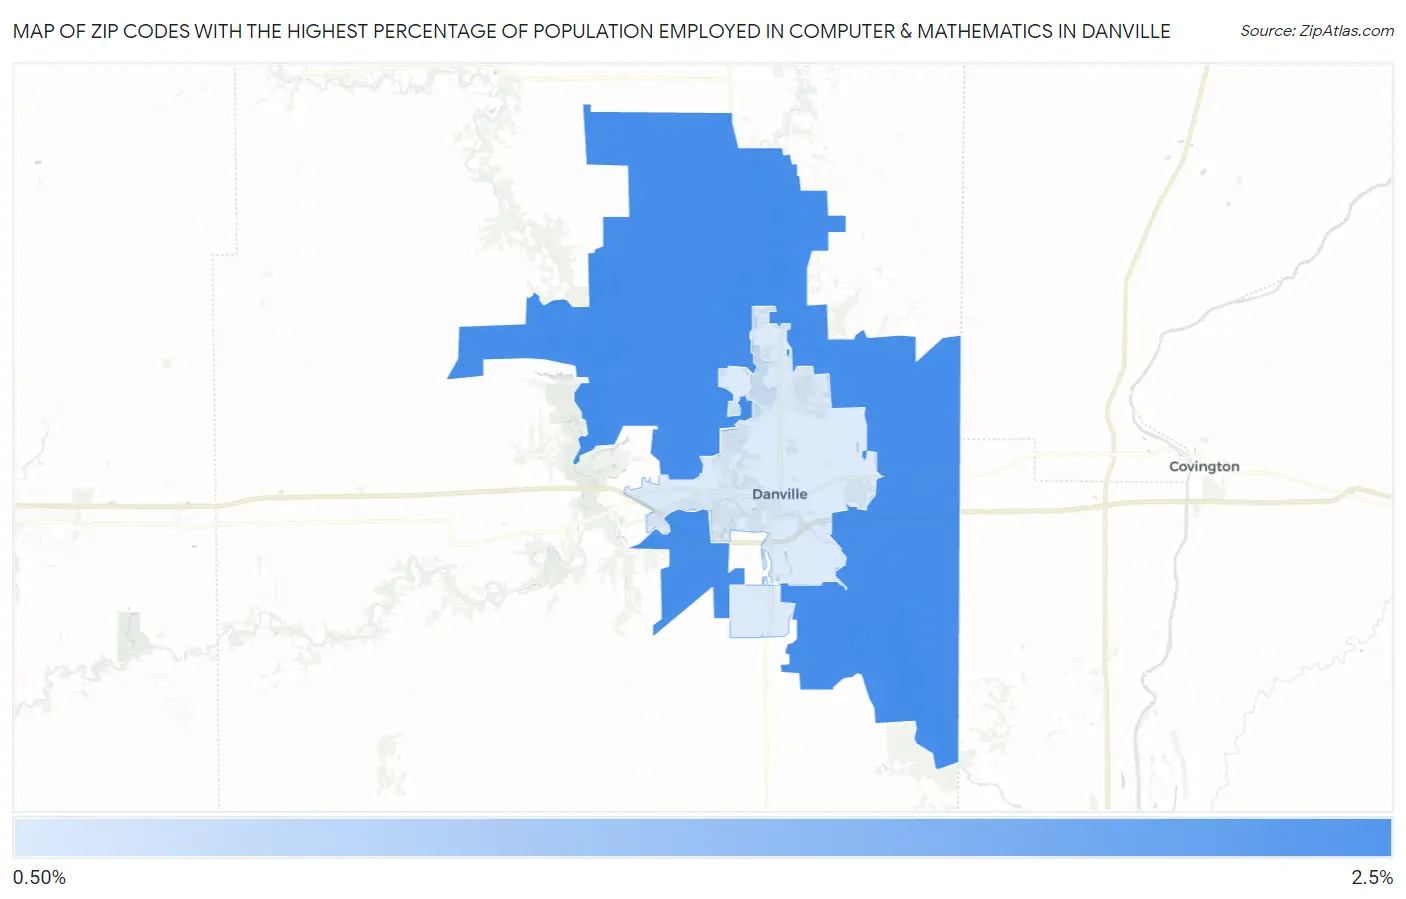
Map of Zip Codes with the Highest Percentage of Population Employed in Computer & Mathematics in Danville
1.2%
2.3%
Zip Codes with the Highest Percentage of Population Employed in Computer & Mathematics in Danville, IL
| Zip Code | % Employed | vs State | vs National | |
| 1. | 61834 | 2.3% | 3.6%(-1.24)#421 | 3.5%(-1.20)#10,330 |
| 2. | 61832 | 1.2% | 3.6%(-2.39)#686 | 3.5%(-2.35)#16,267 |
1
Common Questions
What are the Top Zip Codes with the Highest Percentage of Population Employed in Computer & Mathematics in Danville, IL?
Top Zip Codes with the Highest Percentage of Population Employed in Computer & Mathematics in Danville, IL are:
What zip code has the Highest Percentage of Population Employed in Computer & Mathematics in Danville, IL?
61834 has the Highest Percentage of Population Employed in Computer & Mathematics in Danville, IL with 2.3%.
What is the Percentage of Population Employed in Computer & Mathematics in Danville, IL?
Percentage of Population Employed in Computer & Mathematics in Danville is 1.1%.
What is the Percentage of Population Employed in Computer & Mathematics in Illinois?
Percentage of Population Employed in Computer & Mathematics in Illinois is 3.6%.
What is the Percentage of Population Employed in Computer & Mathematics in the United States?
Percentage of Population Employed in Computer & Mathematics in the United States is 3.5%.