Zip Codes with the Highest Percentage of Population with a Degree in Computers and Mathematics in Danville, IL
RELATED REPORTS & OPTIONS
Computers and Mathematics
Danville
Compare Zip Codes
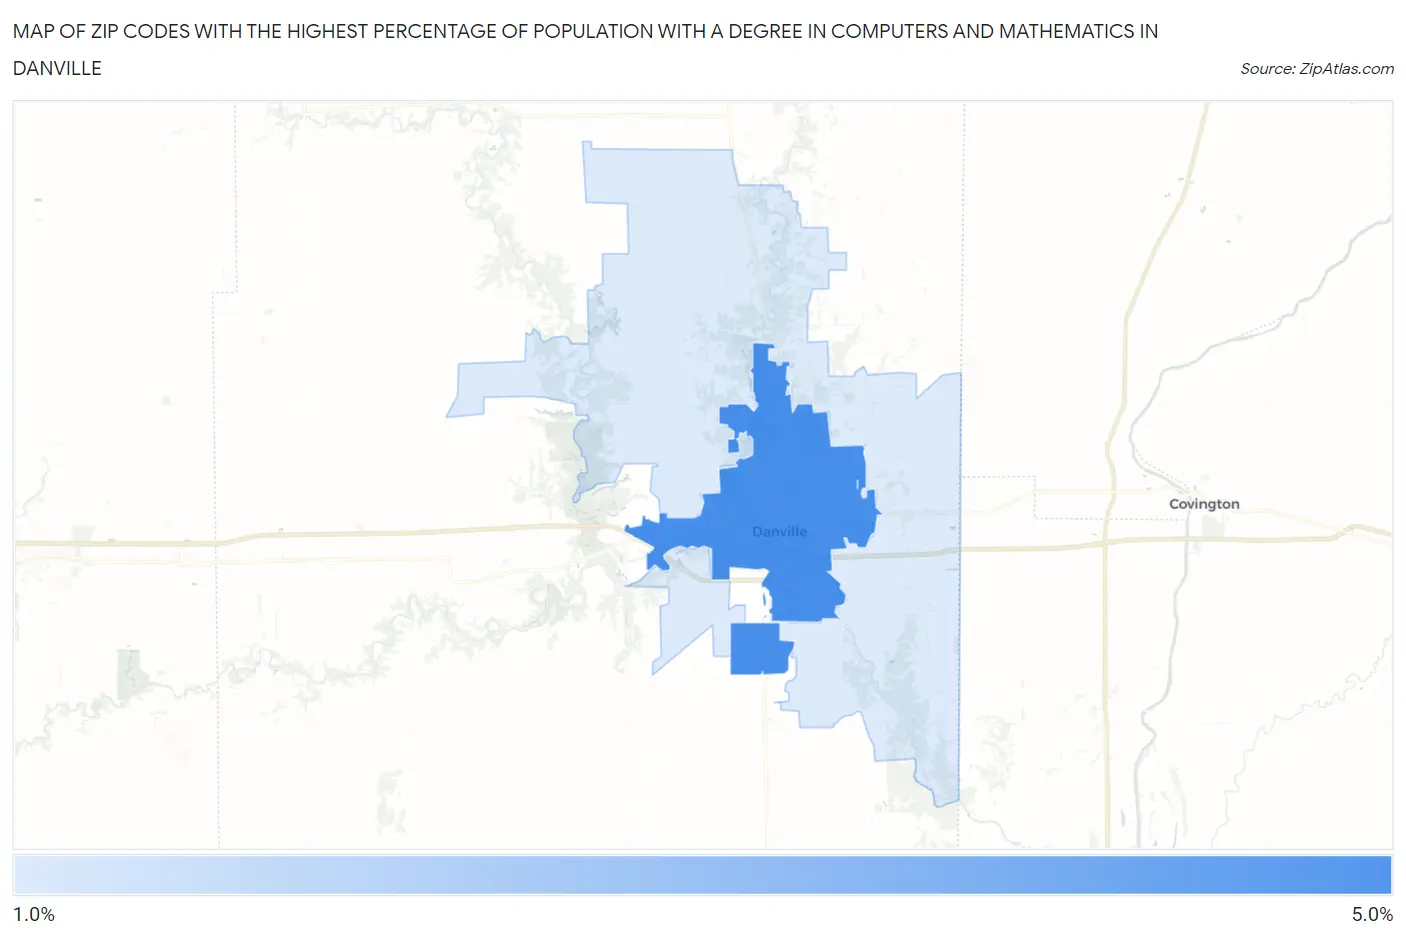
Map of Zip Codes with the Highest Percentage of Population with a Degree in Computers and Mathematics in Danville
1.2%
4.7%
Zip Codes with the Highest Percentage of Population with a Degree in Computers and Mathematics in Danville, IL
| Zip Code | % Graduates | vs State | vs National | |
| 1. | 61832 | 4.7% | 5.1%(-0.376)#361 | 4.9%(-0.213)#8,330 |
| 2. | 61834 | 1.2% | 5.1%(-3.90)#846 | 4.9%(-3.74)#20,103 |
1
Common Questions
What are the Top Zip Codes with the Highest Percentage of Population with a Degree in Computers and Mathematics in Danville, IL?
Top Zip Codes with the Highest Percentage of Population with a Degree in Computers and Mathematics in Danville, IL are:
What zip code has the Highest Percentage of Population with a Degree in Computers and Mathematics in Danville, IL?
61832 has the Highest Percentage of Population with a Degree in Computers and Mathematics in Danville, IL with 4.7%.
What is the Percentage of Population with a Degree in Computers and Mathematics in Danville, IL?
Percentage of Population with a Degree in Computers and Mathematics in Danville is 4.6%.
What is the Percentage of Population with a Degree in Computers and Mathematics in Illinois?
Percentage of Population with a Degree in Computers and Mathematics in Illinois is 5.1%.
What is the Percentage of Population with a Degree in Computers and Mathematics in the United States?
Percentage of Population with a Degree in Computers and Mathematics in the United States is 4.9%.