Zip Codes with the Highest Percentage of Population Employed in Sales & Related in Danville, IL
RELATED REPORTS & OPTIONS
Sales & Related
Danville
Compare Zip Codes
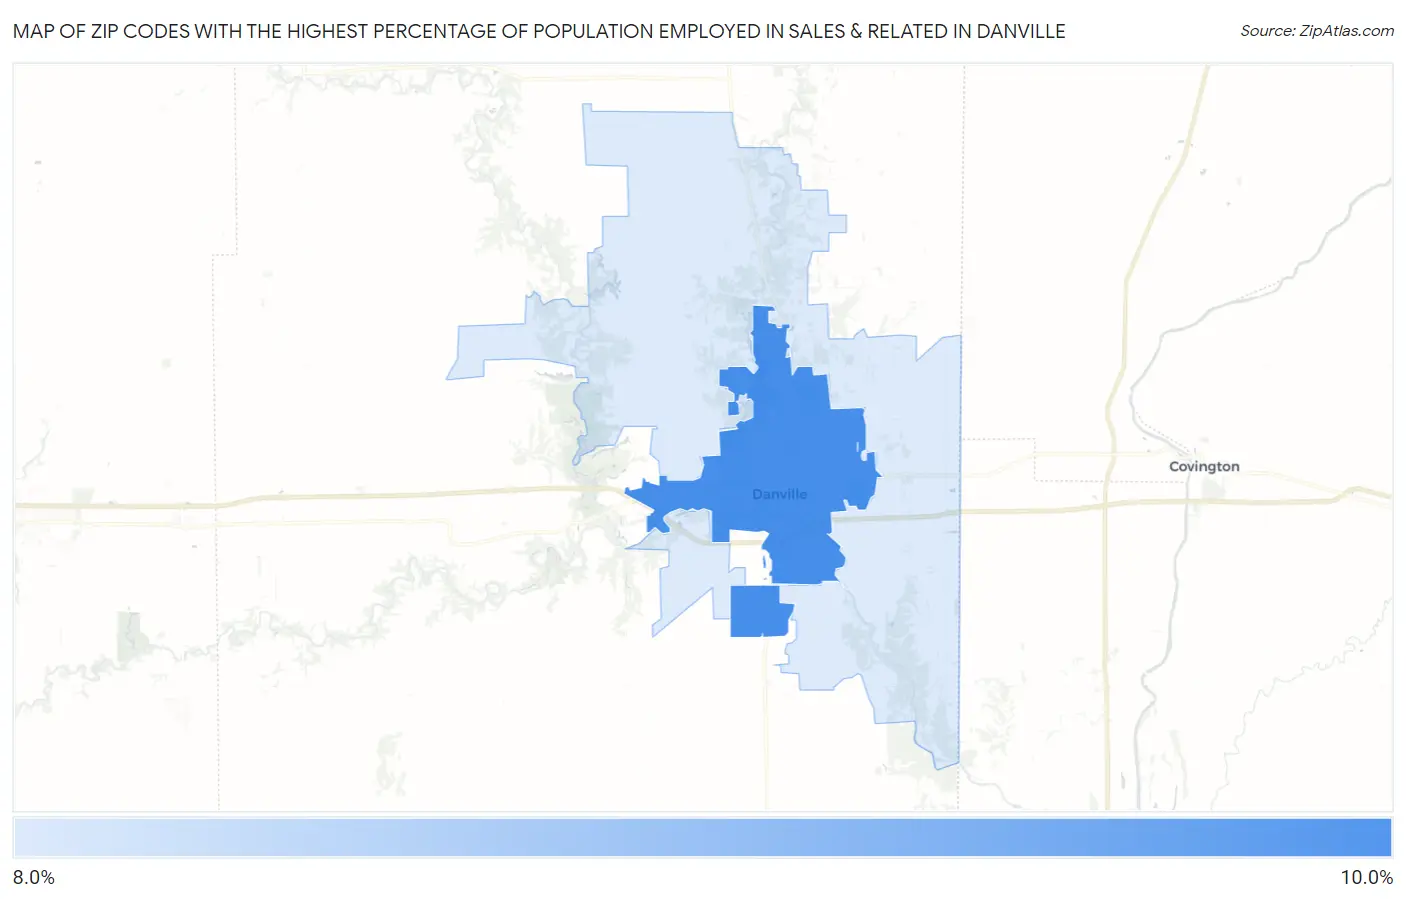
Map of Zip Codes with the Highest Percentage of Population Employed in Sales & Related in Danville
9.0%
9.8%
Zip Codes with the Highest Percentage of Population Employed in Sales & Related in Danville, IL
| Zip Code | % Employed | vs State | vs National | |
| 1. | 61832 | 9.8% | 9.6%(+0.246)#468 | 9.6%(+0.213)#11,607 |
| 2. | 61834 | 9.0% | 9.6%(-0.570)#592 | 9.6%(-0.604)#14,537 |
1
Common Questions
What are the Top Zip Codes with the Highest Percentage of Population Employed in Sales & Related in Danville, IL?
Top Zip Codes with the Highest Percentage of Population Employed in Sales & Related in Danville, IL are:
What zip code has the Highest Percentage of Population Employed in Sales & Related in Danville, IL?
61832 has the Highest Percentage of Population Employed in Sales & Related in Danville, IL with 9.8%.
What is the Percentage of Population Employed in Sales & Related in Danville, IL?
Percentage of Population Employed in Sales & Related in Danville is 10.1%.
What is the Percentage of Population Employed in Sales & Related in Illinois?
Percentage of Population Employed in Sales & Related in Illinois is 9.6%.
What is the Percentage of Population Employed in Sales & Related in the United States?
Percentage of Population Employed in Sales & Related in the United States is 9.6%.