Zip Codes with the Highest Percentage of Population Employed in Legal Services & Support in Champaign, IL
RELATED REPORTS & OPTIONS
Legal Services & Support
Champaign
Compare Zip Codes
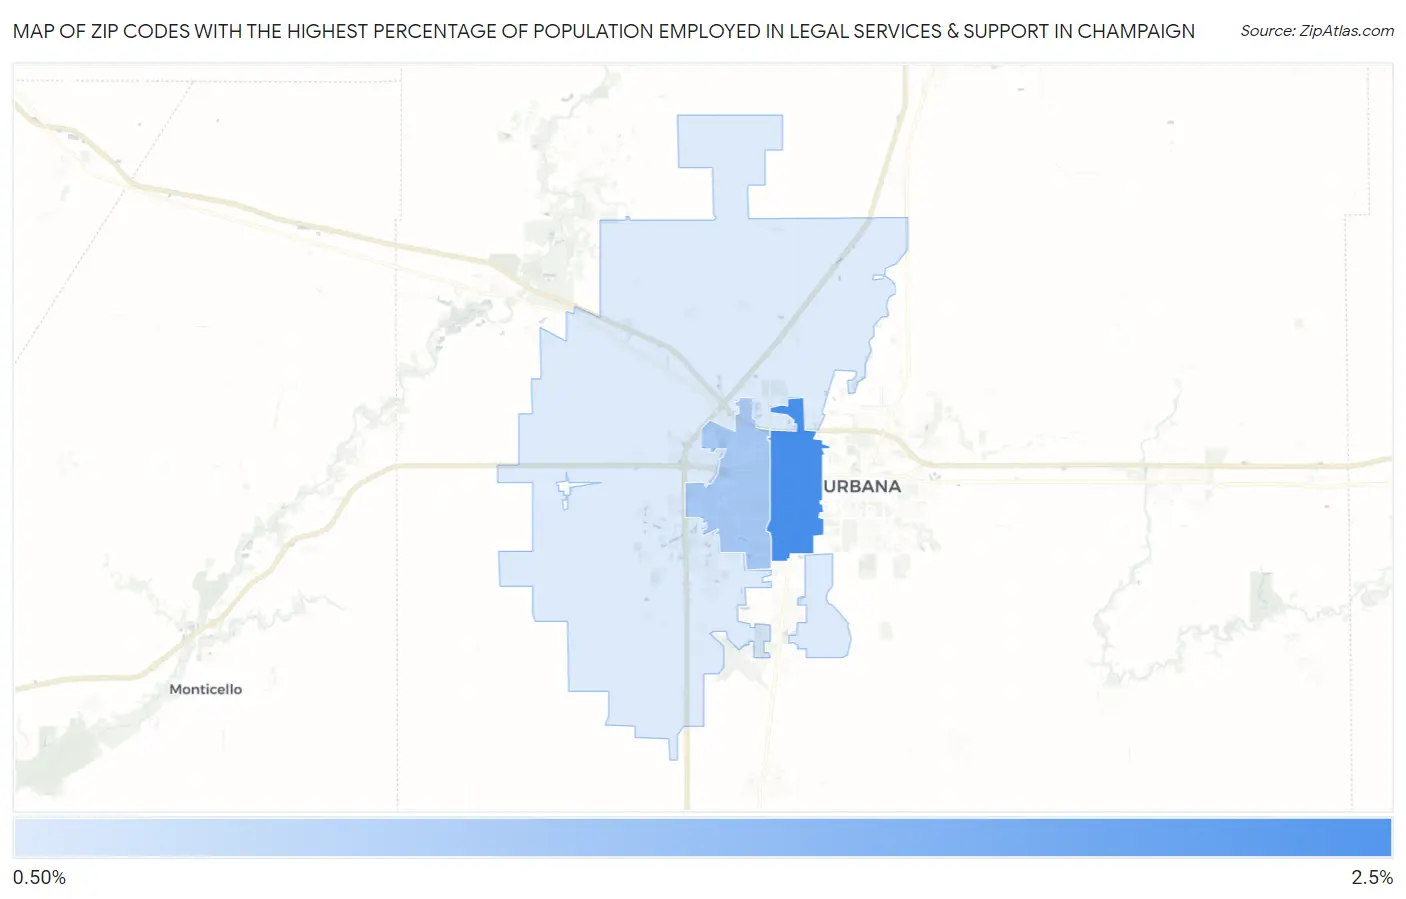
Map of Zip Codes with the Highest Percentage of Population Employed in Legal Services & Support in Champaign
0.76%
2.4%
Zip Codes with the Highest Percentage of Population Employed in Legal Services & Support in Champaign, IL
| Zip Code | % Employed | vs State | vs National | |
| 1. | 61820 | 2.4% | 1.3%(+1.10)#100 | 1.2%(+1.27)#2,599 |
| 2. | 61821 | 1.4% | 1.3%(+0.034)#203 | 1.2%(+0.200)#5,548 |
| 3. | 61822 | 0.76% | 1.3%(-0.592)#363 | 1.2%(-0.426)#9,843 |
1
Common Questions
What are the Top Zip Codes with the Highest Percentage of Population Employed in Legal Services & Support in Champaign, IL?
Top Zip Codes with the Highest Percentage of Population Employed in Legal Services & Support in Champaign, IL are:
What zip code has the Highest Percentage of Population Employed in Legal Services & Support in Champaign, IL?
61820 has the Highest Percentage of Population Employed in Legal Services & Support in Champaign, IL with 2.4%.
What is the Percentage of Population Employed in Legal Services & Support in Champaign, IL?
Percentage of Population Employed in Legal Services & Support in Champaign is 1.5%.
What is the Percentage of Population Employed in Legal Services & Support in Illinois?
Percentage of Population Employed in Legal Services & Support in Illinois is 1.3%.
What is the Percentage of Population Employed in Legal Services & Support in the United States?
Percentage of Population Employed in Legal Services & Support in the United States is 1.2%.