Zip Codes with the Highest Percentage of Population Employed in Computer & Mathematics in Champaign, IL
RELATED REPORTS & OPTIONS
Computer & Mathematics
Champaign
Compare Zip Codes
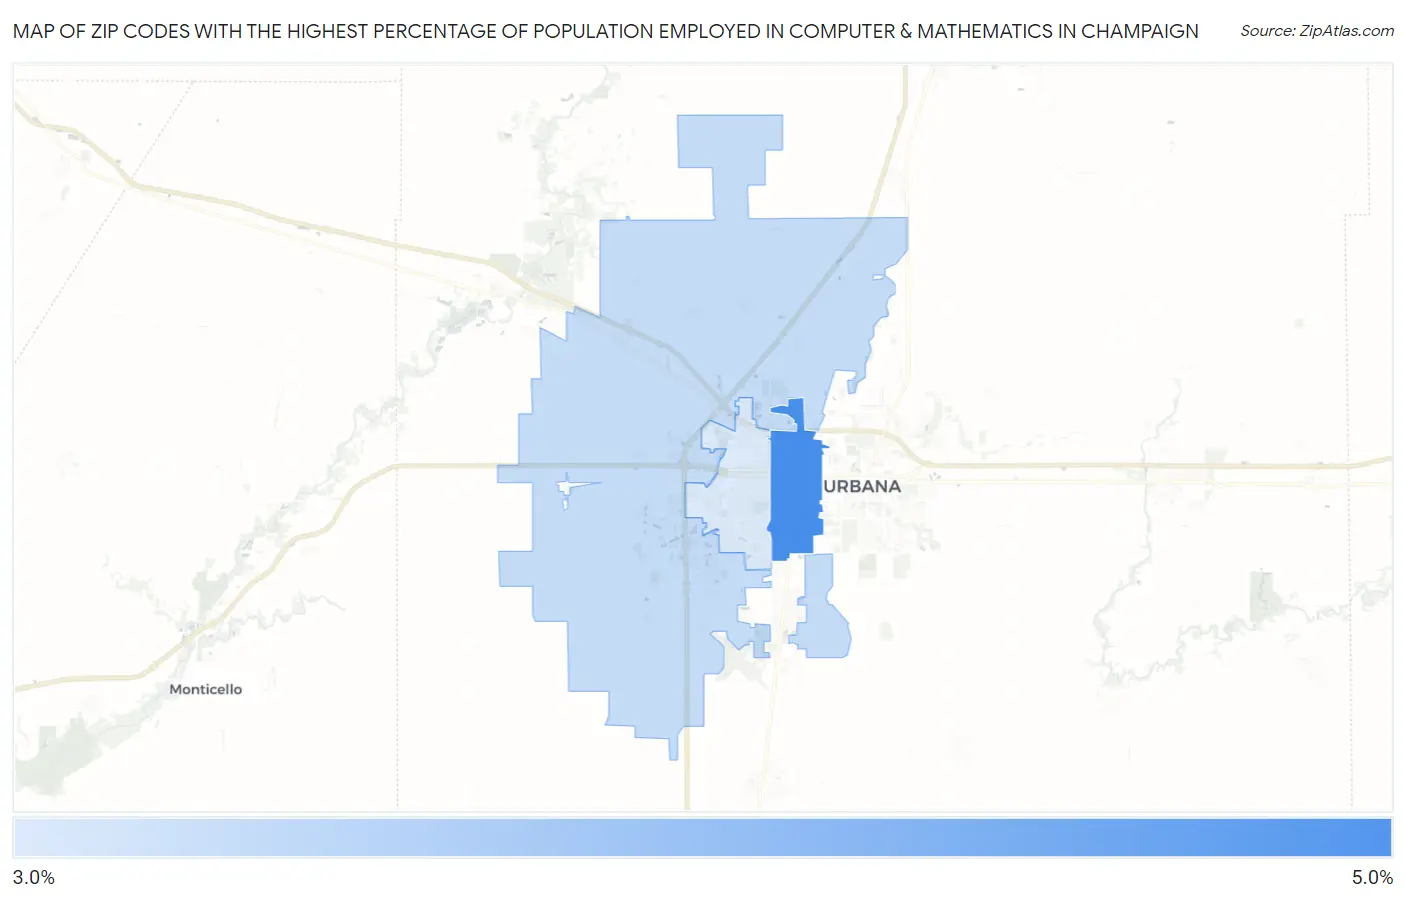
Map of Zip Codes with the Highest Percentage of Population Employed in Computer & Mathematics in Champaign
3.9%
4.3%
Zip Codes with the Highest Percentage of Population Employed in Computer & Mathematics in Champaign, IL
| Zip Code | % Employed | vs State | vs National | |
| 1. | 61820 | 4.3% | 3.6%(+0.756)#186 | 3.5%(+0.794)#4,398 |
| 2. | 61822 | 3.9% | 3.6%(+0.358)#217 | 3.5%(+0.396)#5,208 |
| 3. | 61821 | 3.9% | 3.6%(+0.289)#228 | 3.5%(+0.327)#5,356 |
1
Common Questions
What are the Top Zip Codes with the Highest Percentage of Population Employed in Computer & Mathematics in Champaign, IL?
Top Zip Codes with the Highest Percentage of Population Employed in Computer & Mathematics in Champaign, IL are:
What zip code has the Highest Percentage of Population Employed in Computer & Mathematics in Champaign, IL?
61820 has the Highest Percentage of Population Employed in Computer & Mathematics in Champaign, IL with 4.3%.
What is the Percentage of Population Employed in Computer & Mathematics in Champaign, IL?
Percentage of Population Employed in Computer & Mathematics in Champaign is 4.2%.
What is the Percentage of Population Employed in Computer & Mathematics in Illinois?
Percentage of Population Employed in Computer & Mathematics in Illinois is 3.6%.
What is the Percentage of Population Employed in Computer & Mathematics in the United States?
Percentage of Population Employed in Computer & Mathematics in the United States is 3.5%.