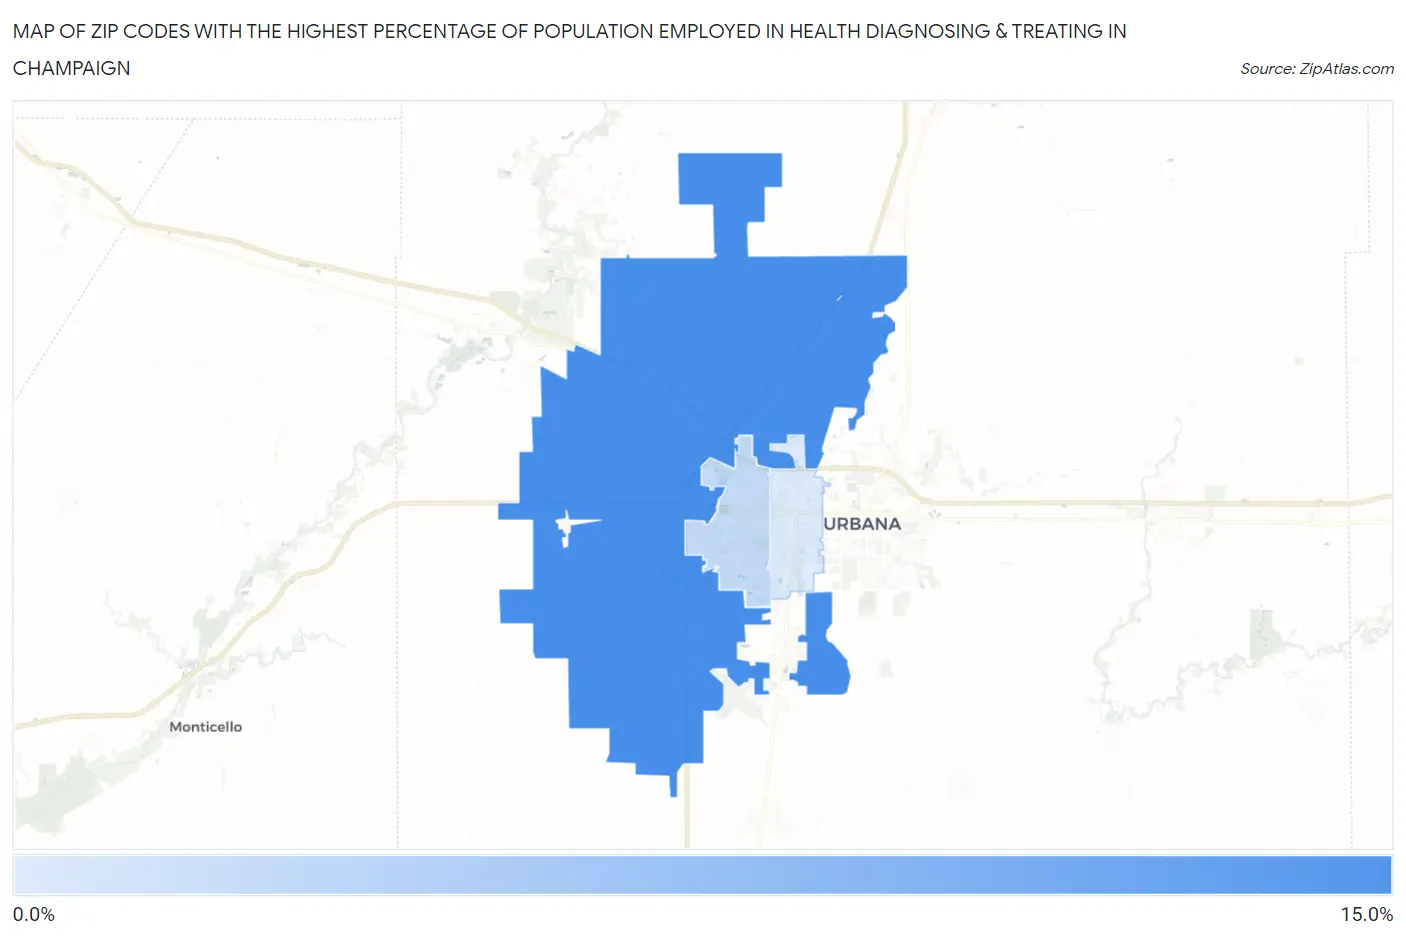
Zip Codes with the Highest Percentage of Population Employed in Health Diagnosing & Treating in Champaign, IL
RELATED REPORTS & OPTIONS
Health Diagnosing & Treating
Champaign
Compare Zip Codes
Map of Zip Codes with the Highest Percentage of Population Employed in Health Diagnosing & Treating in Champaign
4.1%
11.6%
Zip Codes with the Highest Percentage of Population Employed in Health Diagnosing & Treating in Champaign, IL
| Zip Code | % Employed | vs State | vs National | |
| 1. | 61822 | 11.6% | 6.2%(+5.37)#121 | 6.2%(+5.36)#2,450 |
| 2. | 61821 | 5.4% | 6.2%(-0.883)#768 | 6.2%(-0.892)#16,350 |
| 3. | 61820 | 4.1% | 6.2%(-2.12)#993 | 6.2%(-2.13)#21,003 |
1
Common Questions
What are the Top Zip Codes with the Highest Percentage of Population Employed in Health Diagnosing & Treating in Champaign, IL?
Top Zip Codes with the Highest Percentage of Population Employed in Health Diagnosing & Treating in Champaign, IL are:
What zip code has the Highest Percentage of Population Employed in Health Diagnosing & Treating in Champaign, IL?
61822 has the Highest Percentage of Population Employed in Health Diagnosing & Treating in Champaign, IL with 11.6%.
What is the Percentage of Population Employed in Health Diagnosing & Treating in Champaign, IL?
Percentage of Population Employed in Health Diagnosing & Treating in Champaign is 7.0%.
What is the Percentage of Population Employed in Health Diagnosing & Treating in Illinois?
Percentage of Population Employed in Health Diagnosing & Treating in Illinois is 6.2%.
What is the Percentage of Population Employed in Health Diagnosing & Treating in the United States?
Percentage of Population Employed in Health Diagnosing & Treating in the United States is 6.2%.