Zip Codes with the Highest Percentage of Population Employed in Architecture & Engineering in Champaign, IL
RELATED REPORTS & OPTIONS
Architecture & Engineering
Champaign
Compare Zip Codes
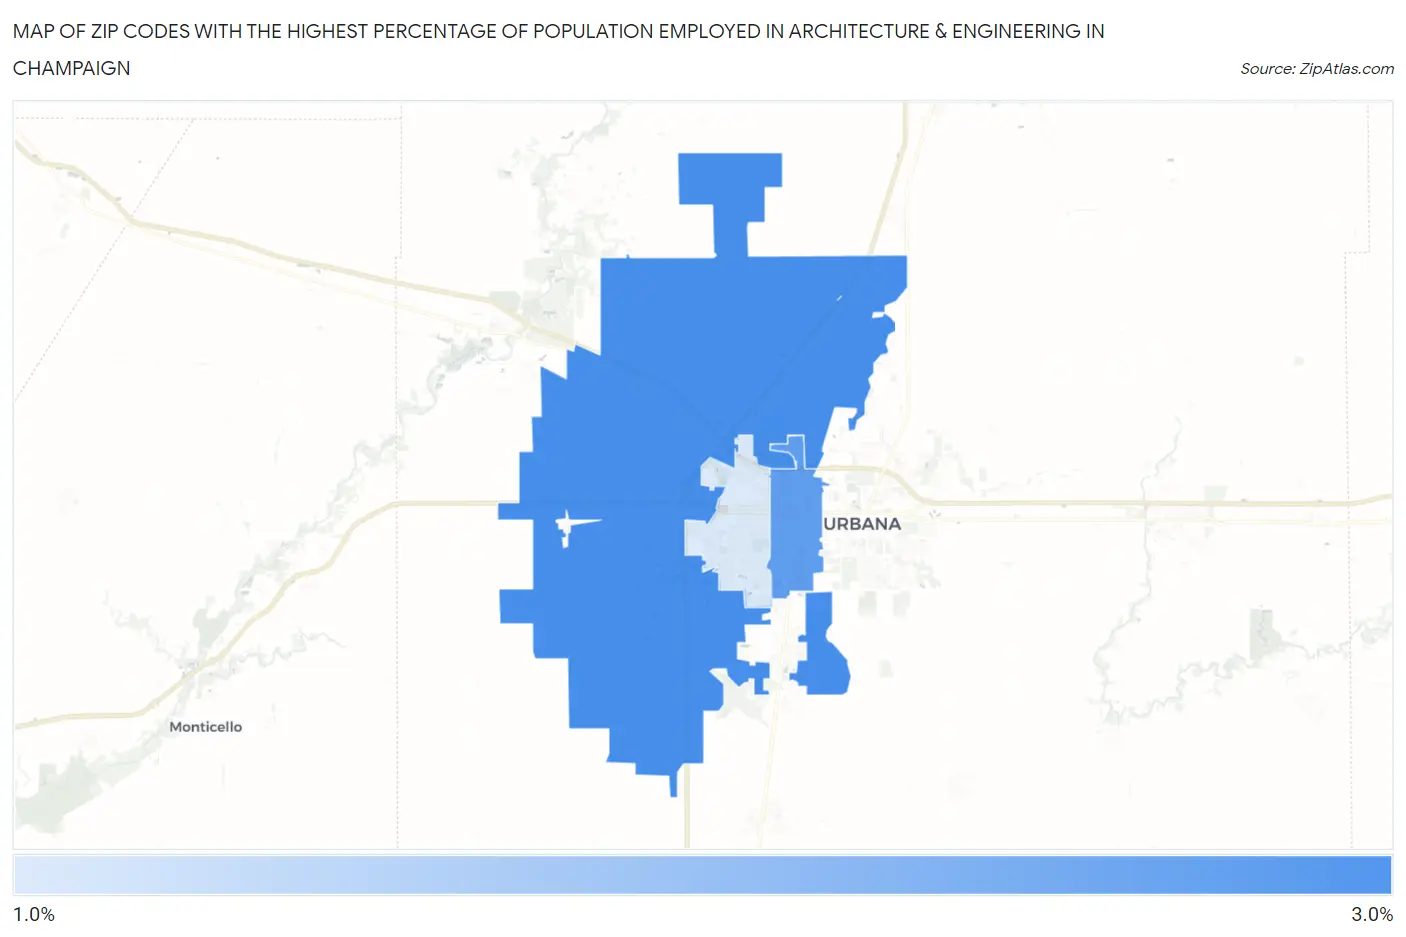
Map of Zip Codes with the Highest Percentage of Population Employed in Architecture & Engineering in Champaign
1.3%
3.0%
Zip Codes with the Highest Percentage of Population Employed in Architecture & Engineering in Champaign, IL
| Zip Code | % Employed | vs State | vs National | |
| 1. | 61822 | 3.0% | 1.9%(+1.09)#190 | 2.1%(+0.833)#5,113 |
| 2. | 61820 | 2.7% | 1.9%(+0.795)#242 | 2.1%(+0.540)#6,208 |
| 3. | 61821 | 1.3% | 1.9%(-0.622)#611 | 2.1%(-0.877)#14,507 |
1
Common Questions
What are the Top Zip Codes with the Highest Percentage of Population Employed in Architecture & Engineering in Champaign, IL?
Top Zip Codes with the Highest Percentage of Population Employed in Architecture & Engineering in Champaign, IL are:
What zip code has the Highest Percentage of Population Employed in Architecture & Engineering in Champaign, IL?
61822 has the Highest Percentage of Population Employed in Architecture & Engineering in Champaign, IL with 3.0%.
What is the Percentage of Population Employed in Architecture & Engineering in Champaign, IL?
Percentage of Population Employed in Architecture & Engineering in Champaign is 2.4%.
What is the Percentage of Population Employed in Architecture & Engineering in Illinois?
Percentage of Population Employed in Architecture & Engineering in Illinois is 1.9%.
What is the Percentage of Population Employed in Architecture & Engineering in the United States?
Percentage of Population Employed in Architecture & Engineering in the United States is 2.1%.