Macedonian vs Immigrants from West Indies GED/Equivalency
COMPARE
Macedonian
Immigrants from West Indies
GED/Equivalency
GED/Equivalency Comparison
Macedonians
Immigrants from West Indies
88.1%
GED/EQUIVALENCY
99.5/ 100
METRIC RATING
44th/ 347
METRIC RANK
82.4%
GED/EQUIVALENCY
0.0/ 100
METRIC RATING
286th/ 347
METRIC RANK
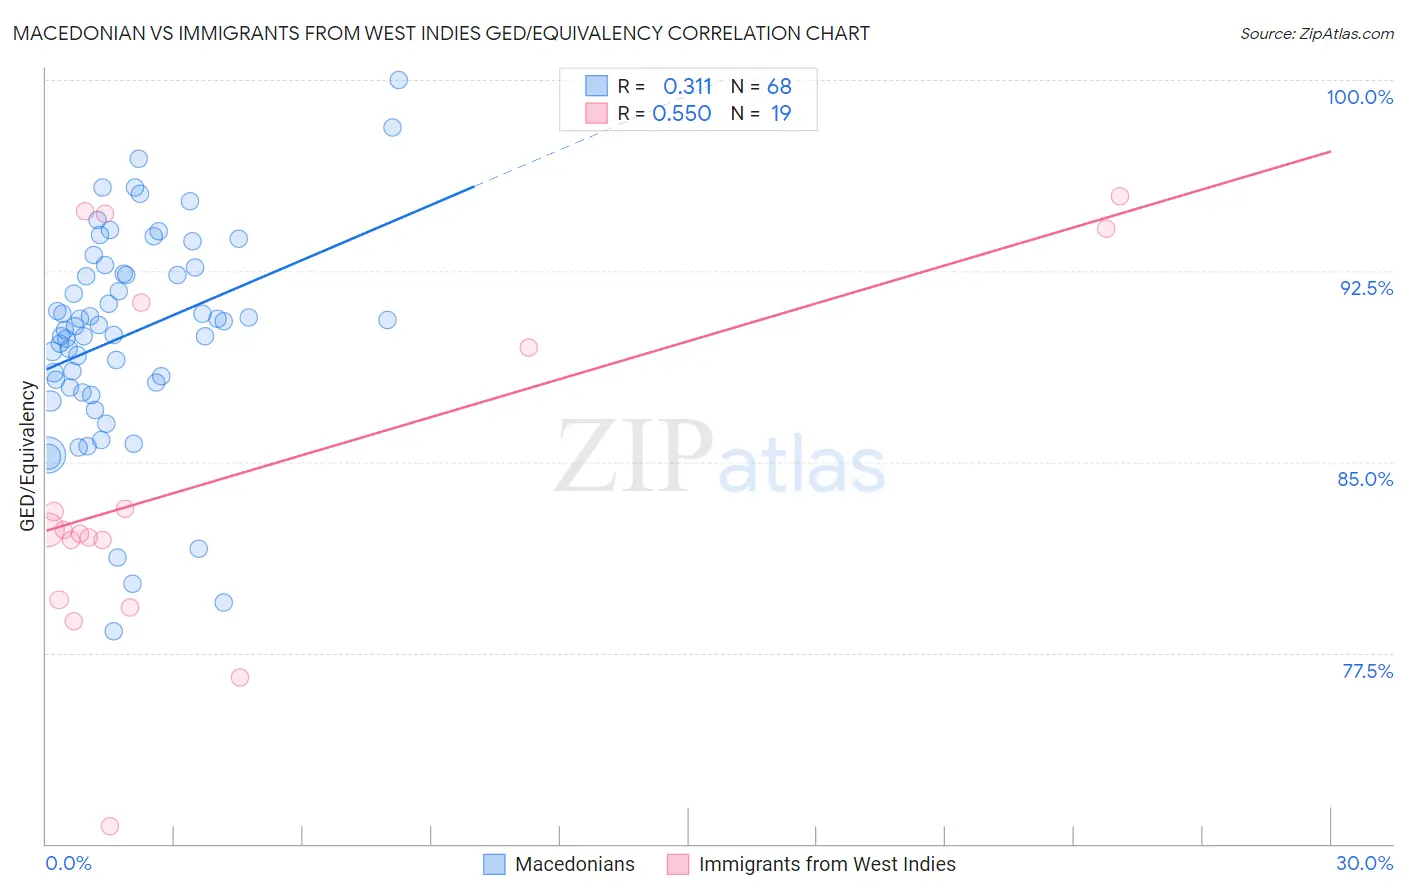
Macedonian vs Immigrants from West Indies GED/Equivalency Correlation Chart
The statistical analysis conducted on geographies consisting of 132,657,099 people shows a mild positive correlation between the proportion of Macedonians and percentage of population with at least ged/equivalency education in the United States with a correlation coefficient (R) of 0.311 and weighted average of 88.1%. Similarly, the statistical analysis conducted on geographies consisting of 72,457,514 people shows a substantial positive correlation between the proportion of Immigrants from West Indies and percentage of population with at least ged/equivalency education in the United States with a correlation coefficient (R) of 0.550 and weighted average of 82.4%, a difference of 7.0%.
GED/Equivalency Correlation Summary
| Measurement | Macedonian | Immigrants from West Indies |
| Minimum | 78.4% | 70.7% |
| Maximum | 100.0% | 95.4% |
| Range | 21.6% | 24.7% |
| Mean | 90.0% | 84.4% |
| Median | 90.4% | 82.3% |
| Interquartile 25% (IQ1) | 88.0% | 79.6% |
| Interquartile 75% (IQ3) | 92.5% | 91.2% |
| Interquartile Range (IQR) | 4.5% | 11.7% |
| Standard Deviation (Sample) | 4.2% | 7.0% |
| Standard Deviation (Population) | 4.2% | 6.8% |
Similar Demographics by GED/Equivalency
Demographics Similar to Macedonians by GED/Equivalency
In terms of ged/equivalency, the demographic groups most similar to Macedonians are Immigrants from Scotland (88.2%, a difference of 0.030%), Cambodian (88.2%, a difference of 0.040%), Czech (88.1%, a difference of 0.040%), Immigrants from Switzerland (88.1%, a difference of 0.050%), and Finnish (88.2%, a difference of 0.060%).
| Demographics | Rating | Rank | GED/Equivalency |
| Immigrants | Austria | 99.7 /100 | #37 | Exceptional 88.3% |
| Burmese | 99.7 /100 | #38 | Exceptional 88.3% |
| Immigrants | Israel | 99.6 /100 | #39 | Exceptional 88.2% |
| Italians | 99.6 /100 | #40 | Exceptional 88.2% |
| Finns | 99.6 /100 | #41 | Exceptional 88.2% |
| Cambodians | 99.6 /100 | #42 | Exceptional 88.2% |
| Immigrants | Scotland | 99.6 /100 | #43 | Exceptional 88.2% |
| Macedonians | 99.5 /100 | #44 | Exceptional 88.1% |
| Czechs | 99.5 /100 | #45 | Exceptional 88.1% |
| Immigrants | Switzerland | 99.5 /100 | #46 | Exceptional 88.1% |
| Immigrants | Latvia | 99.5 /100 | #47 | Exceptional 88.1% |
| Greeks | 99.5 /100 | #48 | Exceptional 88.1% |
| Australians | 99.5 /100 | #49 | Exceptional 88.1% |
| Immigrants | Korea | 99.5 /100 | #50 | Exceptional 88.1% |
| Immigrants | Netherlands | 99.4 /100 | #51 | Exceptional 88.0% |
Demographics Similar to Immigrants from West Indies by GED/Equivalency
In terms of ged/equivalency, the demographic groups most similar to Immigrants from West Indies are Cajun (82.4%, a difference of 0.020%), Japanese (82.4%, a difference of 0.020%), Immigrants from Barbados (82.4%, a difference of 0.060%), Pueblo (82.3%, a difference of 0.12%), and Indonesian (82.5%, a difference of 0.18%).
| Demographics | Rating | Rank | GED/Equivalency |
| Immigrants | Fiji | 0.1 /100 | #279 | Tragic 82.7% |
| Cheyenne | 0.1 /100 | #280 | Tragic 82.7% |
| Sioux | 0.1 /100 | #281 | Tragic 82.6% |
| Immigrants | Immigrants | 0.1 /100 | #282 | Tragic 82.6% |
| Indonesians | 0.1 /100 | #283 | Tragic 82.5% |
| Immigrants | Barbados | 0.1 /100 | #284 | Tragic 82.4% |
| Cajuns | 0.0 /100 | #285 | Tragic 82.4% |
| Immigrants | West Indies | 0.0 /100 | #286 | Tragic 82.4% |
| Japanese | 0.0 /100 | #287 | Tragic 82.4% |
| Pueblo | 0.0 /100 | #288 | Tragic 82.3% |
| Immigrants | Cambodia | 0.0 /100 | #289 | Tragic 82.2% |
| Haitians | 0.0 /100 | #290 | Tragic 82.1% |
| Cubans | 0.0 /100 | #291 | Tragic 82.0% |
| Paiute | 0.0 /100 | #292 | Tragic 82.0% |
| British West Indians | 0.0 /100 | #293 | Tragic 82.0% |