Macedonian vs Immigrants from Nepal GED/Equivalency
COMPARE
Macedonian
Immigrants from Nepal
GED/Equivalency
GED/Equivalency Comparison
Macedonians
Immigrants from Nepal
88.1%
GED/EQUIVALENCY
99.5/ 100
METRIC RATING
44th/ 347
METRIC RANK
86.2%
GED/EQUIVALENCY
73.3/ 100
METRIC RATING
156th/ 347
METRIC RANK
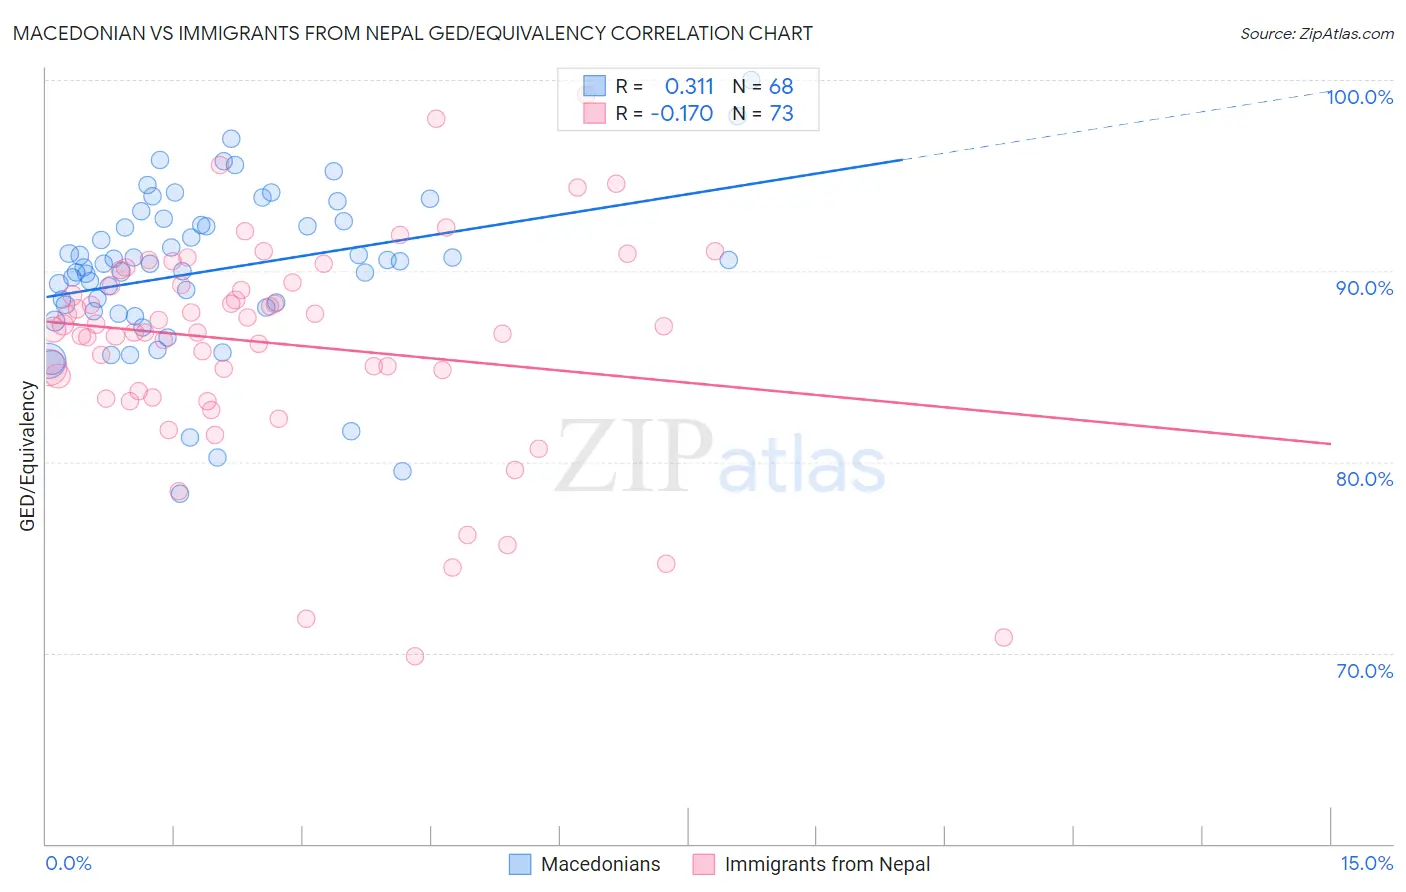
Macedonian vs Immigrants from Nepal GED/Equivalency Correlation Chart
The statistical analysis conducted on geographies consisting of 132,657,099 people shows a mild positive correlation between the proportion of Macedonians and percentage of population with at least ged/equivalency education in the United States with a correlation coefficient (R) of 0.311 and weighted average of 88.1%. Similarly, the statistical analysis conducted on geographies consisting of 186,780,807 people shows a poor negative correlation between the proportion of Immigrants from Nepal and percentage of population with at least ged/equivalency education in the United States with a correlation coefficient (R) of -0.170 and weighted average of 86.2%, a difference of 2.2%.
GED/Equivalency Correlation Summary
| Measurement | Macedonian | Immigrants from Nepal |
| Minimum | 78.4% | 69.8% |
| Maximum | 100.0% | 99.2% |
| Range | 21.6% | 29.4% |
| Mean | 90.0% | 86.2% |
| Median | 90.4% | 86.9% |
| Interquartile 25% (IQ1) | 88.0% | 83.5% |
| Interquartile 75% (IQ3) | 92.5% | 89.3% |
| Interquartile Range (IQR) | 4.5% | 5.8% |
| Standard Deviation (Sample) | 4.2% | 5.7% |
| Standard Deviation (Population) | 4.2% | 5.7% |
Similar Demographics by GED/Equivalency
Demographics Similar to Macedonians by GED/Equivalency
In terms of ged/equivalency, the demographic groups most similar to Macedonians are Immigrants from Scotland (88.2%, a difference of 0.030%), Cambodian (88.2%, a difference of 0.040%), Czech (88.1%, a difference of 0.040%), Immigrants from Switzerland (88.1%, a difference of 0.050%), and Finnish (88.2%, a difference of 0.060%).
| Demographics | Rating | Rank | GED/Equivalency |
| Immigrants | Austria | 99.7 /100 | #37 | Exceptional 88.3% |
| Burmese | 99.7 /100 | #38 | Exceptional 88.3% |
| Immigrants | Israel | 99.6 /100 | #39 | Exceptional 88.2% |
| Italians | 99.6 /100 | #40 | Exceptional 88.2% |
| Finns | 99.6 /100 | #41 | Exceptional 88.2% |
| Cambodians | 99.6 /100 | #42 | Exceptional 88.2% |
| Immigrants | Scotland | 99.6 /100 | #43 | Exceptional 88.2% |
| Macedonians | 99.5 /100 | #44 | Exceptional 88.1% |
| Czechs | 99.5 /100 | #45 | Exceptional 88.1% |
| Immigrants | Switzerland | 99.5 /100 | #46 | Exceptional 88.1% |
| Immigrants | Latvia | 99.5 /100 | #47 | Exceptional 88.1% |
| Greeks | 99.5 /100 | #48 | Exceptional 88.1% |
| Australians | 99.5 /100 | #49 | Exceptional 88.1% |
| Immigrants | Korea | 99.5 /100 | #50 | Exceptional 88.1% |
| Immigrants | Netherlands | 99.4 /100 | #51 | Exceptional 88.0% |
Demographics Similar to Immigrants from Nepal by GED/Equivalency
In terms of ged/equivalency, the demographic groups most similar to Immigrants from Nepal are White/Caucasian (86.2%, a difference of 0.030%), German Russian (86.2%, a difference of 0.030%), Immigrants from Kenya (86.2%, a difference of 0.040%), Iraqi (86.2%, a difference of 0.050%), and Armenian (86.3%, a difference of 0.080%).
| Demographics | Rating | Rank | GED/Equivalency |
| Menominee | 79.3 /100 | #149 | Good 86.3% |
| Immigrants | Western Asia | 78.8 /100 | #150 | Good 86.3% |
| Immigrants | Bosnia and Herzegovina | 77.9 /100 | #151 | Good 86.3% |
| Brazilians | 77.2 /100 | #152 | Good 86.3% |
| Kenyans | 76.6 /100 | #153 | Good 86.3% |
| Armenians | 76.4 /100 | #154 | Good 86.3% |
| Iraqis | 75.2 /100 | #155 | Good 86.2% |
| Immigrants | Nepal | 73.3 /100 | #156 | Good 86.2% |
| Whites/Caucasians | 72.2 /100 | #157 | Good 86.2% |
| German Russians | 72.1 /100 | #158 | Good 86.2% |
| Immigrants | Kenya | 71.8 /100 | #159 | Good 86.2% |
| Immigrants | Morocco | 69.5 /100 | #160 | Good 86.1% |
| Immigrants | Syria | 69.3 /100 | #161 | Good 86.1% |
| Immigrants | Iraq | 68.1 /100 | #162 | Good 86.1% |
| Ugandans | 66.3 /100 | #163 | Good 86.1% |