Macedonian vs Fijian GED/Equivalency
COMPARE
Macedonian
Fijian
GED/Equivalency
GED/Equivalency Comparison
Macedonians
Fijians
88.1%
GED/EQUIVALENCY
99.5/ 100
METRIC RATING
44th/ 347
METRIC RANK
81.6%
GED/EQUIVALENCY
0.0/ 100
METRIC RATING
300th/ 347
METRIC RANK
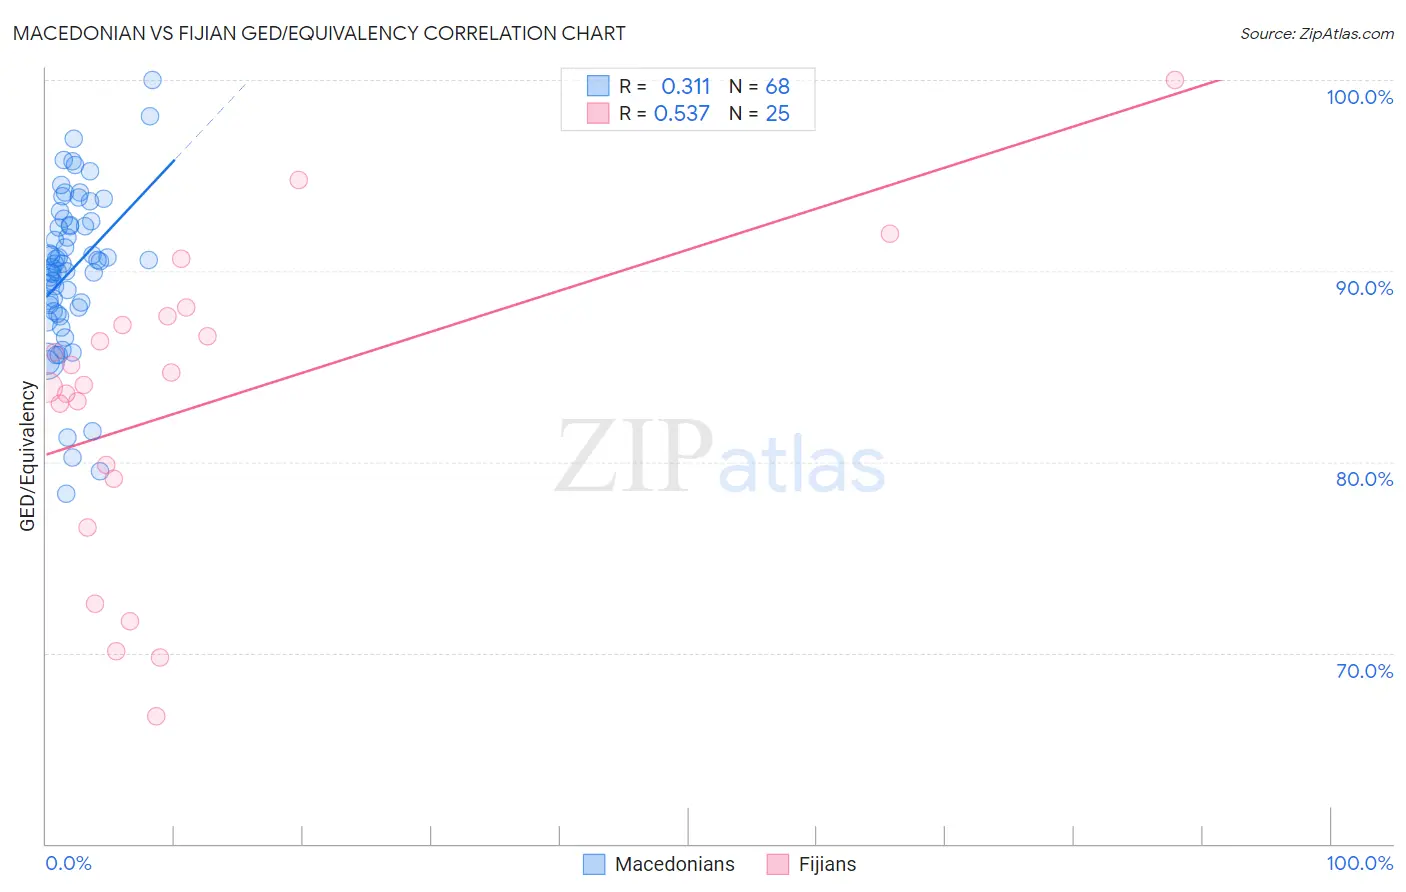
Macedonian vs Fijian GED/Equivalency Correlation Chart
The statistical analysis conducted on geographies consisting of 132,657,099 people shows a mild positive correlation between the proportion of Macedonians and percentage of population with at least ged/equivalency education in the United States with a correlation coefficient (R) of 0.311 and weighted average of 88.1%. Similarly, the statistical analysis conducted on geographies consisting of 55,948,842 people shows a substantial positive correlation between the proportion of Fijians and percentage of population with at least ged/equivalency education in the United States with a correlation coefficient (R) of 0.537 and weighted average of 81.6%, a difference of 8.0%.
GED/Equivalency Correlation Summary
| Measurement | Macedonian | Fijian |
| Minimum | 78.4% | 66.7% |
| Maximum | 100.0% | 100.0% |
| Range | 21.6% | 33.3% |
| Mean | 90.0% | 82.9% |
| Median | 90.4% | 84.0% |
| Interquartile 25% (IQ1) | 88.0% | 77.9% |
| Interquartile 75% (IQ3) | 92.5% | 87.4% |
| Interquartile Range (IQR) | 4.5% | 9.6% |
| Standard Deviation (Sample) | 4.2% | 8.1% |
| Standard Deviation (Population) | 4.2% | 8.0% |
Similar Demographics by GED/Equivalency
Demographics Similar to Macedonians by GED/Equivalency
In terms of ged/equivalency, the demographic groups most similar to Macedonians are Immigrants from Scotland (88.2%, a difference of 0.030%), Cambodian (88.2%, a difference of 0.040%), Czech (88.1%, a difference of 0.040%), Immigrants from Switzerland (88.1%, a difference of 0.050%), and Finnish (88.2%, a difference of 0.060%).
| Demographics | Rating | Rank | GED/Equivalency |
| Immigrants | Austria | 99.7 /100 | #37 | Exceptional 88.3% |
| Burmese | 99.7 /100 | #38 | Exceptional 88.3% |
| Immigrants | Israel | 99.6 /100 | #39 | Exceptional 88.2% |
| Italians | 99.6 /100 | #40 | Exceptional 88.2% |
| Finns | 99.6 /100 | #41 | Exceptional 88.2% |
| Cambodians | 99.6 /100 | #42 | Exceptional 88.2% |
| Immigrants | Scotland | 99.6 /100 | #43 | Exceptional 88.2% |
| Macedonians | 99.5 /100 | #44 | Exceptional 88.1% |
| Czechs | 99.5 /100 | #45 | Exceptional 88.1% |
| Immigrants | Switzerland | 99.5 /100 | #46 | Exceptional 88.1% |
| Immigrants | Latvia | 99.5 /100 | #47 | Exceptional 88.1% |
| Greeks | 99.5 /100 | #48 | Exceptional 88.1% |
| Australians | 99.5 /100 | #49 | Exceptional 88.1% |
| Immigrants | Korea | 99.5 /100 | #50 | Exceptional 88.1% |
| Immigrants | Netherlands | 99.4 /100 | #51 | Exceptional 88.0% |
Demographics Similar to Fijians by GED/Equivalency
In terms of ged/equivalency, the demographic groups most similar to Fijians are Dutch West Indian (81.6%, a difference of 0.060%), Ecuadorian (81.7%, a difference of 0.070%), Immigrants from Haiti (81.6%, a difference of 0.10%), Immigrants from Portugal (81.6%, a difference of 0.10%), and Ute (81.8%, a difference of 0.20%).
| Demographics | Rating | Rank | GED/Equivalency |
| British West Indians | 0.0 /100 | #293 | Tragic 82.0% |
| Immigrants | St. Vincent and the Grenadines | 0.0 /100 | #294 | Tragic 82.0% |
| Nepalese | 0.0 /100 | #295 | Tragic 81.9% |
| Vietnamese | 0.0 /100 | #296 | Tragic 81.9% |
| Immigrants | Bangladesh | 0.0 /100 | #297 | Tragic 81.9% |
| Ute | 0.0 /100 | #298 | Tragic 81.8% |
| Ecuadorians | 0.0 /100 | #299 | Tragic 81.7% |
| Fijians | 0.0 /100 | #300 | Tragic 81.6% |
| Dutch West Indians | 0.0 /100 | #301 | Tragic 81.6% |
| Immigrants | Haiti | 0.0 /100 | #302 | Tragic 81.6% |
| Immigrants | Portugal | 0.0 /100 | #303 | Tragic 81.6% |
| Navajo | 0.0 /100 | #304 | Tragic 81.5% |
| Immigrants | Grenada | 0.0 /100 | #305 | Tragic 81.3% |
| Guyanese | 0.0 /100 | #306 | Tragic 81.3% |
| Immigrants | Dominica | 0.0 /100 | #307 | Tragic 81.1% |