Central American Indian vs Pueblo GED/Equivalency
COMPARE
Central American Indian
Pueblo
GED/Equivalency
GED/Equivalency Comparison
Central American Indians
Pueblo
80.6%
GED/EQUIVALENCY
0.0/ 100
METRIC RATING
316th/ 347
METRIC RANK
82.3%
GED/EQUIVALENCY
0.0/ 100
METRIC RATING
288th/ 347
METRIC RANK
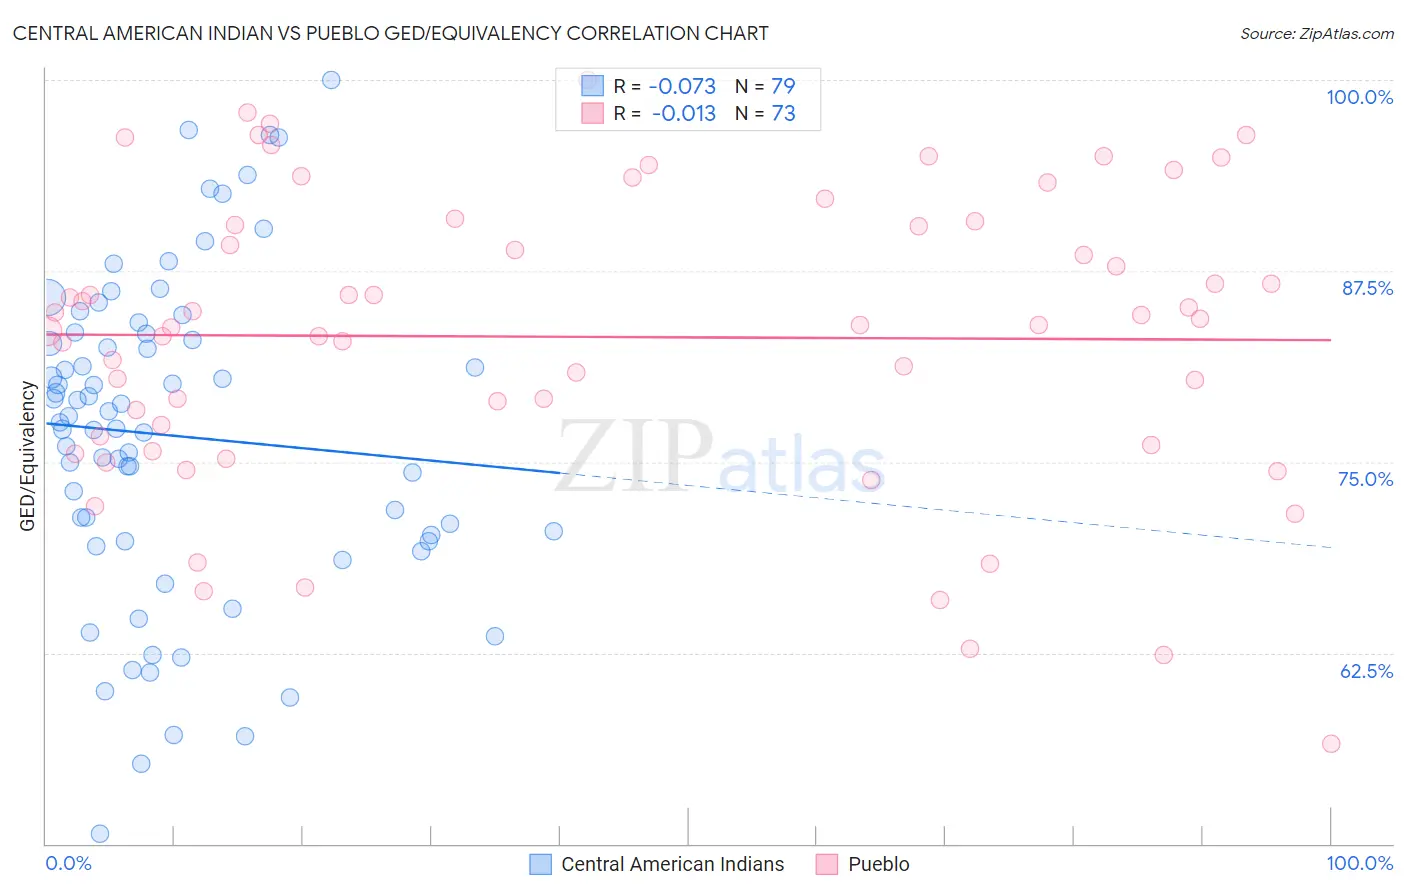
Central American Indian vs Pueblo GED/Equivalency Correlation Chart
The statistical analysis conducted on geographies consisting of 326,142,643 people shows a slight negative correlation between the proportion of Central American Indians and percentage of population with at least ged/equivalency education in the United States with a correlation coefficient (R) of -0.073 and weighted average of 80.6%. Similarly, the statistical analysis conducted on geographies consisting of 120,086,468 people shows no correlation between the proportion of Pueblo and percentage of population with at least ged/equivalency education in the United States with a correlation coefficient (R) of -0.013 and weighted average of 82.3%, a difference of 2.1%.
GED/Equivalency Correlation Summary
| Measurement | Central American Indian | Pueblo |
| Minimum | 50.7% | 56.5% |
| Maximum | 100.0% | 100.0% |
| Range | 49.3% | 43.5% |
| Mean | 76.7% | 83.2% |
| Median | 77.6% | 84.0% |
| Interquartile 25% (IQ1) | 69.8% | 76.4% |
| Interquartile 75% (IQ3) | 83.4% | 90.6% |
| Interquartile Range (IQR) | 13.6% | 14.2% |
| Standard Deviation (Sample) | 10.5% | 9.6% |
| Standard Deviation (Population) | 10.4% | 9.6% |
Similar Demographics by GED/Equivalency
Demographics Similar to Central American Indians by GED/Equivalency
In terms of ged/equivalency, the demographic groups most similar to Central American Indians are Immigrants from Caribbean (80.5%, a difference of 0.10%), Apache (80.7%, a difference of 0.13%), Yaqui (80.5%, a difference of 0.13%), Immigrants from Belize (80.5%, a difference of 0.13%), and Belizean (80.9%, a difference of 0.39%).
| Demographics | Rating | Rank | GED/Equivalency |
| Immigrants | Ecuador | 0.0 /100 | #309 | Tragic 81.0% |
| Immigrants | Guyana | 0.0 /100 | #310 | Tragic 81.0% |
| Natives/Alaskans | 0.0 /100 | #311 | Tragic 80.9% |
| Nicaraguans | 0.0 /100 | #312 | Tragic 80.9% |
| Cape Verdeans | 0.0 /100 | #313 | Tragic 80.9% |
| Belizeans | 0.0 /100 | #314 | Tragic 80.9% |
| Apache | 0.0 /100 | #315 | Tragic 80.7% |
| Central American Indians | 0.0 /100 | #316 | Tragic 80.6% |
| Immigrants | Caribbean | 0.0 /100 | #317 | Tragic 80.5% |
| Yaqui | 0.0 /100 | #318 | Tragic 80.5% |
| Immigrants | Belize | 0.0 /100 | #319 | Tragic 80.5% |
| Immigrants | Cuba | 0.0 /100 | #320 | Tragic 80.2% |
| Yup'ik | 0.0 /100 | #321 | Tragic 80.0% |
| Lumbee | 0.0 /100 | #322 | Tragic 80.0% |
| Immigrants | Nicaragua | 0.0 /100 | #323 | Tragic 79.9% |
Demographics Similar to Pueblo by GED/Equivalency
In terms of ged/equivalency, the demographic groups most similar to Pueblo are Immigrants from Cambodia (82.2%, a difference of 0.080%), Japanese (82.4%, a difference of 0.10%), Immigrants from West Indies (82.4%, a difference of 0.12%), Cajun (82.4%, a difference of 0.14%), and Immigrants from Barbados (82.4%, a difference of 0.17%).
| Demographics | Rating | Rank | GED/Equivalency |
| Sioux | 0.1 /100 | #281 | Tragic 82.6% |
| Immigrants | Immigrants | 0.1 /100 | #282 | Tragic 82.6% |
| Indonesians | 0.1 /100 | #283 | Tragic 82.5% |
| Immigrants | Barbados | 0.1 /100 | #284 | Tragic 82.4% |
| Cajuns | 0.0 /100 | #285 | Tragic 82.4% |
| Immigrants | West Indies | 0.0 /100 | #286 | Tragic 82.4% |
| Japanese | 0.0 /100 | #287 | Tragic 82.4% |
| Pueblo | 0.0 /100 | #288 | Tragic 82.3% |
| Immigrants | Cambodia | 0.0 /100 | #289 | Tragic 82.2% |
| Haitians | 0.0 /100 | #290 | Tragic 82.1% |
| Cubans | 0.0 /100 | #291 | Tragic 82.0% |
| Paiute | 0.0 /100 | #292 | Tragic 82.0% |
| British West Indians | 0.0 /100 | #293 | Tragic 82.0% |
| Immigrants | St. Vincent and the Grenadines | 0.0 /100 | #294 | Tragic 82.0% |
| Nepalese | 0.0 /100 | #295 | Tragic 81.9% |