Czechoslovakian Married-couple Households
COMPARE
Czechoslovakian
Select to Compare
Married-couple Households
Czechoslovakian Married-couple Households
48.5%
MARRIED-COUPLE HOUSEHOLDS
99.2/ 100
METRIC RATING
59th/ 347
METRIC RANK
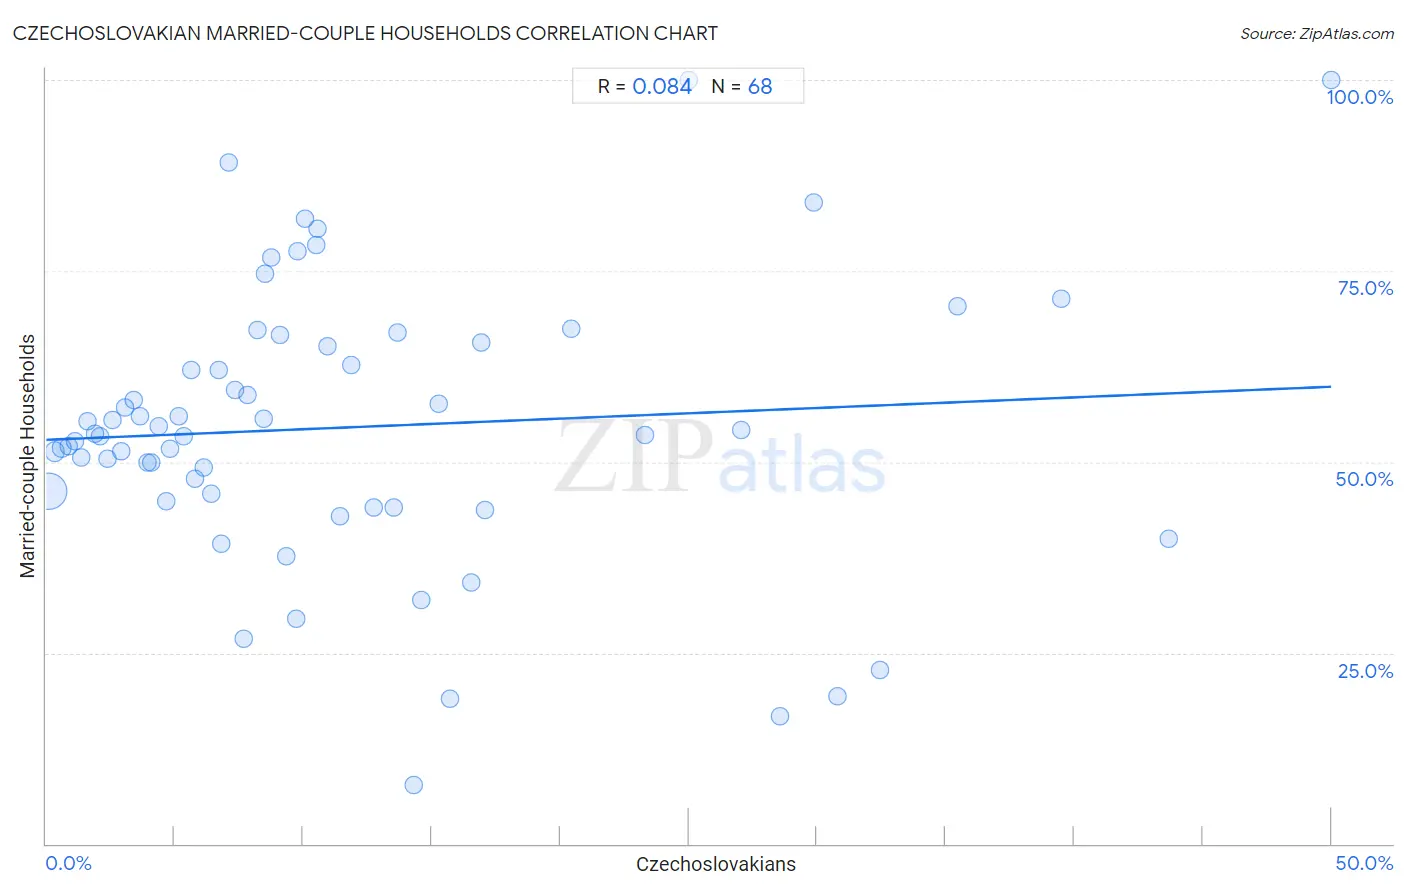
Czechoslovakian Married-couple Households Correlation Chart
The statistical analysis conducted on geographies consisting of 368,521,204 people shows a slight positive correlation between the proportion of Czechoslovakians and percentage of married-couple family households in the United States with a correlation coefficient (R) of 0.084 and weighted average of 48.5%. On average, for every 1% (one percent) increase in Czechoslovakians within a typical geography, there is an increase of 0.14% in percentage of married-couple family households.
It is essential to understand that the correlation between the percentage of Czechoslovakians and percentage of married-couple family households does not imply a direct cause-and-effect relationship. It remains uncertain whether the presence of Czechoslovakians influences an upward or downward trend in the level of percentage of married-couple family households within an area, or if Czechoslovakians simply ended up residing in those areas with higher or lower levels of percentage of married-couple family households due to other factors.
Demographics Similar to Czechoslovakians by Married-couple Households
In terms of married-couple households, the demographic groups most similar to Czechoslovakians are Immigrants from Indonesia (48.5%, a difference of 0.0%), Polish (48.5%, a difference of 0.010%), Croatian (48.5%, a difference of 0.080%), Austrian (48.6%, a difference of 0.090%), and Immigrants from Northern Europe (48.6%, a difference of 0.090%).
| Demographics | Rating | Rank | Married-couple Households |
| Irish | 99.3 /100 | #52 | Exceptional 48.6% |
| Whites/Caucasians | 99.3 /100 | #53 | Exceptional 48.6% |
| Immigrants from Lithuania | 99.3 /100 | #54 | Exceptional 48.6% |
| Austrians | 99.3 /100 | #55 | Exceptional 48.6% |
| Immigrants from Northern Europe | 99.3 /100 | #56 | Exceptional 48.6% |
| Poles | 99.2 /100 | #57 | Exceptional 48.5% |
| Immigrants from Indonesia | 99.2 /100 | #58 | Exceptional 48.5% |
| Czechoslovakians | 99.2 /100 | #59 | Exceptional 48.5% |
| Croatians | 99.1 /100 | #60 | Exceptional 48.5% |
| Bulgarians | 99.1 /100 | #61 | Exceptional 48.5% |
| Luxembourgers | 99.1 /100 | #62 | Exceptional 48.5% |
| Basques | 99.0 /100 | #63 | Exceptional 48.4% |
| Northern Europeans | 99.0 /100 | #64 | Exceptional 48.4% |
| Immigrants from Canada | 99.0 /100 | #65 | Exceptional 48.4% |
| Jordanians | 98.9 /100 | #66 | Exceptional 48.4% |
Czechoslovakian Married-couple Households Correlation Summary
| Measurement | Czechoslovakian Data | Married-couple Households Data |
| Minimum | 0.078% | 7.6% |
| Maximum | 50.0% | 100.0% |
| Range | 49.9% | 92.4% |
| Mean | 11.8% | 54.5% |
| Median | 8.5% | 53.6% |
| Interquartile 25% (IQ1) | 4.2% | 45.3% |
| Interquartile 75% (IQ3) | 14.9% | 65.4% |
| Interquartile Range (IQR) | 10.7% | 20.1% |
| Standard Deviation (Sample) | 11.0% | 18.3% |
| Standard Deviation (Population) | 10.9% | 18.1% |
Correlation Details
| Czechoslovakian Percentile | Sample Size | Married-couple Households |
[ 0.0% - 0.5% ] 0.078% | 329,666,204 | 46.2% |
[ 0.0% - 0.5% ] 0.34% | 28,349,202 | 51.3% |
[ 0.5% - 1.0% ] 0.60% | 6,521,858 | 51.8% |
[ 0.5% - 1.0% ] 0.85% | 2,024,661 | 52.1% |
[ 1.0% - 1.5% ] 1.11% | 727,622 | 52.8% |
[ 1.0% - 1.5% ] 1.36% | 489,599 | 50.5% |
[ 1.5% - 2.0% ] 1.61% | 251,576 | 55.4% |
[ 1.5% - 2.0% ] 1.87% | 133,841 | 53.7% |
[ 2.0% - 2.5% ] 2.12% | 51,485 | 53.4% |
[ 2.0% - 2.5% ] 2.37% | 39,264 | 50.3% |
[ 2.5% - 3.0% ] 2.58% | 54,545 | 55.5% |
[ 2.5% - 3.0% ] 2.90% | 34,585 | 51.3% |
[ 3.0% - 3.5% ] 3.09% | 23,303 | 57.0% |
[ 3.0% - 3.5% ] 3.41% | 29,044 | 58.1% |
[ 3.5% - 4.0% ] 3.66% | 23,021 | 56.0% |
[ 3.5% - 4.0% ] 3.93% | 12,327 | 50.0% |
[ 4.0% - 4.5% ] 4.09% | 14,705 | 49.9% |
[ 4.0% - 4.5% ] 4.38% | 11,332 | 54.7% |
[ 4.5% - 5.0% ] 4.66% | 3,714 | 44.8% |
[ 4.5% - 5.0% ] 4.80% | 4,644 | 51.8% |
[ 5.0% - 5.5% ] 5.16% | 6,916 | 55.9% |
[ 5.0% - 5.5% ] 5.34% | 4,061 | 53.4% |
[ 5.5% - 6.0% ] 5.63% | 3,768 | 62.0% |
[ 5.5% - 6.0% ] 5.80% | 1,984 | 47.7% |
[ 6.0% - 6.5% ] 6.14% | 586 | 49.2% |
[ 6.0% - 6.5% ] 6.43% | 3,872 | 45.8% |
[ 6.5% - 7.0% ] 6.71% | 6,197 | 62.1% |
[ 6.5% - 7.0% ] 6.79% | 1,722 | 39.3% |
[ 7.0% - 7.5% ] 7.11% | 211 | 89.2% |
[ 7.0% - 7.5% ] 7.33% | 191 | 59.5% |
[ 7.5% - 8.0% ] 7.69% | 52 | 26.9% |
[ 7.5% - 8.0% ] 7.83% | 4,174 | 58.8% |
[ 8.0% - 8.5% ] 8.20% | 561 | 67.2% |
[ 8.0% - 8.5% ] 8.48% | 2,075 | 55.6% |
[ 8.5% - 9.0% ] 8.52% | 223 | 74.6% |
[ 8.5% - 9.0% ] 8.76% | 605 | 76.8% |
[ 9.0% - 9.5% ] 9.09% | 22 | 66.7% |
[ 9.0% - 9.5% ] 9.35% | 278 | 37.7% |
[ 9.5% - 10.0% ] 9.74% | 154 | 29.5% |
[ 9.5% - 10.0% ] 9.78% | 1,544 | 77.6% |
[ 10.0% - 10.5% ] 10.08% | 1,418 | 81.8% |
[ 10.0% - 10.5% ] 10.50% | 1,810 | 78.4% |
[ 10.5% - 11.0% ] 10.55% | 417 | 80.6% |
[ 10.5% - 11.0% ] 10.92% | 952 | 65.2% |
[ 11.0% - 11.5% ] 11.43% | 1,531 | 42.9% |
[ 11.5% - 12.0% ] 11.86% | 2,175 | 62.7% |
[ 12.5% - 13.0% ] 12.77% | 376 | 44.0% |
[ 13.0% - 13.5% ] 13.50% | 526 | 44.1% |
[ 13.5% - 14.0% ] 13.66% | 161 | 66.9% |
[ 14.0% - 14.5% ] 14.29% | 588 | 7.6% |
[ 14.5% - 15.0% ] 14.59% | 1,775 | 31.9% |
[ 15.0% - 15.5% ] 15.25% | 59 | 57.6% |
[ 15.5% - 16.0% ] 15.69% | 102 | 19.0% |
[ 16.5% - 17.0% ] 16.56% | 151 | 34.2% |
[ 16.5% - 17.0% ] 16.92% | 591 | 65.7% |
[ 17.0% - 17.5% ] 17.09% | 515 | 43.7% |
[ 20.0% - 20.5% ] 20.45% | 489 | 67.4% |
[ 23.0% - 23.5% ] 23.28% | 116 | 53.5% |
[ 25.0% - 25.5% ] 25.00% | 8 | 100.0% |
[ 27.0% - 27.5% ] 27.05% | 122 | 54.2% |
[ 28.5% - 29.0% ] 28.57% | 504 | 16.7% |
[ 29.5% - 30.0% ] 29.89% | 87 | 84.0% |
[ 30.5% - 31.0% ] 30.77% | 468 | 19.4% |
[ 32.0% - 32.5% ] 32.42% | 219 | 22.7% |
[ 35.0% - 35.5% ] 35.46% | 141 | 70.3% |
[ 39.0% - 39.5% ] 39.47% | 38 | 71.4% |
[ 43.5% - 44.0% ] 43.70% | 119 | 40.0% |
[ 50.0% - 50.5% ] 50.00% | 18 | 100.0% |