Czechoslovakian 4 or more Vehicles in Household

COMPARE

Czechoslovakian
Race
Ancestry
AfghanAfricanAlaska NativeAlaskan AthabascanAlbanianAleutAlsatianAmericanApacheArabArapahoArgentineanArmenianAssyrian/Chaldean/SyriacAustralianAustrianBahamianBangladeshiBarbadianBasqueBelgianBelizeanBermudanBhutaneseBlackfeetBolivianBrazilianBritishBritish West IndianBulgarianBurmeseCajunCambodianCanadianCape VerdeanCarpatho RusynCelticCentral AmericanCentral American IndianCherokeeCheyenneChickasawChileanChineseChippewaChoctawColombianColvilleComancheCosta RicanCreeCreekCroatianCrowCubanCypriotCzechCzechoslovakianDanishDelawareDominicanDutchDutch West IndianEastern EuropeanEcuadorianEgyptianEnglishEstonianEthiopianEuropeanFijianFilipinoFinnishFrenchFrench American IndianFrench CanadianGermanGerman RussianGhanaianGreekGuamanian/ChamorroGuatemalanGuyaneseHaitianHmongHonduranHopiHoumaHungarianIcelanderIndian (Asian)IndonesianInupiatIranianIraqiIrishIroquoisIsraeliItalianJamaicanJapaneseJordanianKenyanKiowaKoreanLaotianLatvianLebaneseLiberianLithuanianLumbeeLuxembourgerMacedonianMalaysianMalteseMarshalleseMenomineeMexicanMexican American IndianMongolianMoroccanNative HawaiianNavajoNepaleseNew ZealanderNicaraguanNigerianNorthern EuropeanNorwegianOkinawanOsageOttawaPaiutePakistaniPalestinianPanamanianParaguayanPennsylvania GermanPeruvianPimaPolishPortuguesePotawatomiPuebloPuerto RicanPuget Sound SalishRomanianRussianSalvadoranSamoanScandinavianScotch-IrishScottishSeminoleSenegaleseSerbianShoshoneSierra LeoneanSiouxSlavicSlovakSloveneSomaliSouth AfricanSouth AmericanSouth American IndianSoviet UnionSpaniardSpanishSpanish AmericanSpanish American IndianSri LankanSubsaharan AfricanSudaneseSwedishSwissSyrianTaiwaneseThaiTlingit-HaidaTohono O'OdhamTonganTrinidadian and TobagonianTsimshianTurkishU.S. Virgin IslanderUgandanUkrainianUruguayanUteVenezuelanVietnameseWelshWest IndianYakamaYaquiYugoslavianYumanYup'ikZimbabwean
Immigration
NonimmigrantsImmigrantsAfghanistanAfricaAlbaniaArgentinaArmeniaAsiaAustraliaAustriaBahamasBangladeshBarbadosBelarusBelgiumBelizeBoliviaBosnia and HerzegovinaBrazilBulgariaBurma/MyanmarCabo VerdeCambodiaCameroonCanadaCaribbeanCentral AmericaChileChinaColombiaCongoCosta RicaCroatiaCubaCzechoslovakiaDenmarkDominicaDominican RepublicEastern AfricaEastern AsiaEastern EuropeEcuadorEgyptEl SalvadorEnglandEritreaEthiopiaEuropeFijiFranceGermanyGhanaGreeceGrenadaGuatemalaGuyanaHaitiHondurasHong KongHungaryIndiaIndonesiaIranIraqIrelandIsraelItalyJamaicaJapanJordanKazakhstanKenyaKoreaKuwaitLaosLatin AmericaLatviaLebanonLiberiaLithuaniaMalaysiaMexicoMicronesiaMiddle AfricaMoldovaMoroccoNepalNetherlandsNicaraguaNigeriaNorth AmericaNorth MacedoniaNorthern AfricaNorthern EuropeNorwayOceaniaPakistanPanamaPeruPhilippinesPolandPortugalRomaniaRussiaSaudi ArabiaScotlandSenegalSerbiaSierra LeoneSingaporeSomaliaSouth AfricaSouth AmericaSouth Central AsiaSouth Eastern AsiaSouthern EuropeSpainSri LankaSt. Vincent and the GrenadinesSudanSwedenSwitzerlandSyriaTaiwanThailandTrinidad and TobagoTurkeyUgandaUkraineUruguayUzbekistanVenezuelaVietnamWest IndiesWestern AfricaWestern AsiaWestern EuropeYemenZaireZimbabweAzores
Select to Compare
Race
Ancestry
AfghanAfricanAlaska NativeAlaskan AthabascanAlbanianAleutAlsatianAmericanApacheArabArapahoArgentineanArmenianAssyrian/Chaldean/SyriacAustralianAustrianBahamianBangladeshiBarbadianBasqueBelgianBelizeanBermudanBhutaneseBlackfeetBolivianBrazilianBritishBritish West IndianBulgarianBurmeseCajunCambodianCanadianCape VerdeanCarpatho RusynCelticCentral AmericanCentral American IndianCherokeeCheyenneChickasawChileanChineseChippewaChoctawColombianColvilleComancheCosta RicanCreeCreekCroatianCrowCubanCypriotCzechDanishDelawareDominicanDutchDutch West IndianEastern EuropeanEcuadorianEgyptianEnglishEstonianEthiopianEuropeanFijianFilipinoFinnishFrenchFrench American IndianFrench CanadianGermanGerman RussianGhanaianGreekGuamanian/ChamorroGuatemalanGuyaneseHaitianHmongHonduranHopiHoumaHungarianIcelanderIndian (Asian)IndonesianInupiatIranianIraqiIrishIroquoisIsraeliItalianJamaicanJapaneseJordanianKenyanKiowaKoreanLaotianLatvianLebaneseLiberianLithuanianLumbeeLuxembourgerMacedonianMalaysianMalteseMarshalleseMenomineeMexicanMexican American IndianMongolianMoroccanNative HawaiianNavajoNepaleseNew ZealanderNicaraguanNigerianNorthern EuropeanNorwegianOkinawanOsageOttawaPaiutePakistaniPalestinianPanamanianParaguayanPennsylvania GermanPeruvianPimaPolishPortuguesePotawatomiPuebloPuerto RicanPuget Sound SalishRomanianRussianSalvadoranSamoanScandinavianScotch-IrishScottishSeminoleSenegaleseSerbianShoshoneSierra LeoneanSiouxSlavicSlovakSloveneSomaliSouth AfricanSouth AmericanSouth American IndianSoviet UnionSpaniardSpanishSpanish AmericanSpanish American IndianSri LankanSubsaharan AfricanSudaneseSwedishSwissSyrianTaiwaneseThaiTlingit-HaidaTohono O'OdhamTonganTrinidadian and TobagonianTsimshianTurkishU.S. Virgin IslanderUgandanUkrainianUruguayanUteVenezuelanVietnameseWelshWest IndianYakamaYaquiYugoslavianYumanYup'ikZimbabwean
Immigration
NonimmigrantsImmigrantsAfghanistanAfricaAlbaniaArgentinaArmeniaAsiaAustraliaAustriaBahamasBangladeshBarbadosBelarusBelgiumBelizeBoliviaBosnia and HerzegovinaBrazilBulgariaBurma/MyanmarCabo VerdeCambodiaCameroonCanadaCaribbeanCentral AmericaChileChinaColombiaCongoCosta RicaCroatiaCubaCzechoslovakiaDenmarkDominicaDominican RepublicEastern AfricaEastern AsiaEastern EuropeEcuadorEgyptEl SalvadorEnglandEritreaEthiopiaEuropeFijiFranceGermanyGhanaGreeceGrenadaGuatemalaGuyanaHaitiHondurasHong KongHungaryIndiaIndonesiaIranIraqIrelandIsraelItalyJamaicaJapanJordanKazakhstanKenyaKoreaKuwaitLaosLatin AmericaLatviaLebanonLiberiaLithuaniaMalaysiaMexicoMicronesiaMiddle AfricaMoldovaMoroccoNepalNetherlandsNicaraguaNigeriaNorth AmericaNorth MacedoniaNorthern AfricaNorthern EuropeNorwayOceaniaPakistanPanamaPeruPhilippinesPolandPortugalRomaniaRussiaSaudi ArabiaScotlandSenegalSerbiaSierra LeoneSingaporeSomaliaSouth AfricaSouth AmericaSouth Central AsiaSouth Eastern AsiaSouthern EuropeSpainSri LankaSt. Vincent and the GrenadinesSudanSwedenSwitzerlandSyriaTaiwanThailandTrinidad and TobagoTurkeyUgandaUkraineUruguayUzbekistanVenezuelaVietnamWest IndiesWestern AfricaWestern AsiaWestern EuropeYemenZaireZimbabweAzores
4 or more Vehicles in Household
Income
Poverty
Unemployment
Labor Participation
Family Structure
Vehicle Availability
Education Level
Disability

Czechoslovakian 4 or more Vehicles in Household
Exceptional

7.1%
4+ VEHICLES AVAILABLE
99.3/ 100
METRIC RATING
95th/ 347
METRIC RANK

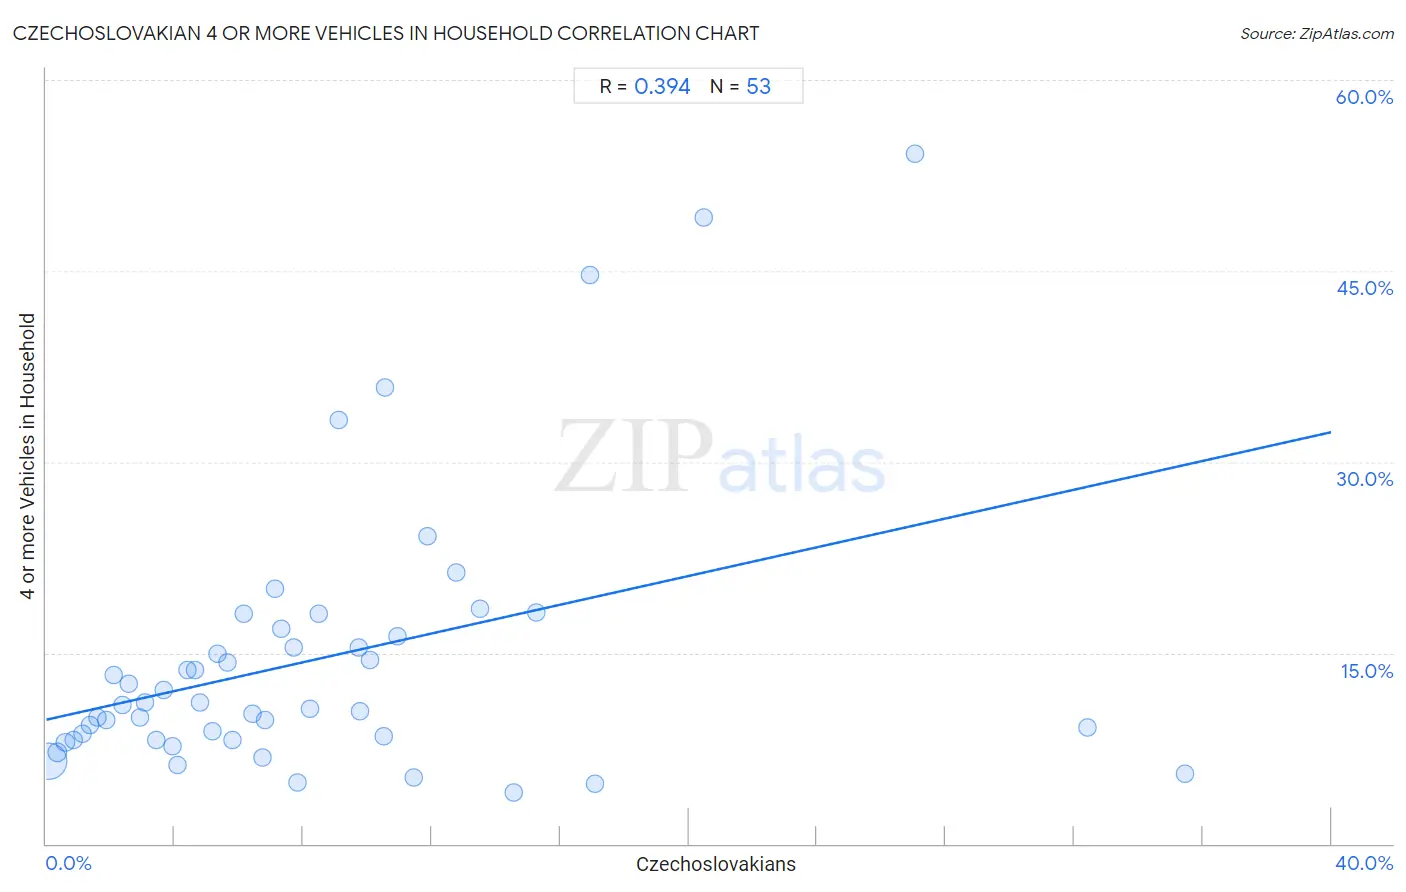
Czechoslovakian 4 or more Vehicles in Household Correlation Chart

The statistical analysis conducted on geographies consisting of 367,717,955 people shows a mild positive correlation between the proportion of Czechoslovakians and percentage of households with 4 or more vehicles available in the United States with a correlation coefficient (R) of 0.394 and weighted average of 7.1%. On average, for every 1% (one percent) increase in Czechoslovakians within a typical geography, there is an increase of 0.56% in percentage of households with 4 or more vehicles available.
Czechoslovakian 4 or more Vehicles in Household
It is essential to understand that the correlation between the percentage of Czechoslovakians and percentage of households with 4 or more vehicles available does not imply a direct cause-and-effect relationship. It remains uncertain whether the presence of Czechoslovakians influences an upward or downward trend in the level of percentage of households with 4 or more vehicles available within an area, or if Czechoslovakians simply ended up residing in those areas with higher or lower levels of percentage of households with 4 or more vehicles available due to other factors.

Demographics Similar to Czechoslovakians by 4 or more Vehicles in Household

In terms of 4 or more vehicles in household, the demographic groups most similar to Czechoslovakians are Central American (7.1%, a difference of 0.010%), Dutch West Indian (7.1%, a difference of 0.21%), Immigrants from Afghanistan (7.1%, a difference of 0.22%), Celtic (7.1%, a difference of 0.37%), and Immigrants from Latin America (7.1%, a difference of 0.39%).
DemographicsRating | Rank4 or more Vehicles in Household
Nonimmigrants
99.6
/100
|
#88
Exceptional
7.2%
British
99.6
/100
|
#89
Exceptional
7.2%
Creek
99.6
/100
|
#90
Exceptional
7.2%
Assyrians/Chaldeans/Syriacs
99.4
/100
|
#91
Exceptional
7.2%
Immigrants from Latin America
99.4
/100
|
#92
Exceptional
7.1%
Immigrants from Afghanistan
99.3
/100
|
#93
Exceptional
7.1%
Dutch West Indians
99.3
/100
|
#94
Exceptional
7.1%
Czechoslovakians
99.3
/100
|
#95
Exceptional
7.1%
Central Americans
99.3
/100
|
#96
Exceptional
7.1%
Celtics
99.1
/100
|
#97
Exceptional
7.1%
Irish
99.0
/100
|
#98
Exceptional
7.1%
Seminole
98.8
/100
|
#99
Exceptional
7.0%
Taiwanese
98.7
/100
|
#100
Exceptional
7.0%
Pakistanis
98.7
/100
|
#101
Exceptional
7.0%
Asians
98.6
/100
|
#102
Exceptional
7.0%

Czechoslovakian 4 or more Vehicles in Household Correlation Summary

MeasurementCzechoslovakian Data4 or more Vehicles in Household Data
Minimum0.078%4.1%
Maximum35.5%54.2%
Range35.4%50.1%
Mean8.4%14.5%
Median6.7%10.9%
Interquartile 25% (IQ1)3.2%8.2%
Interquartile 75% (IQ3)10.7%16.6%
Interquartile Range (IQR)7.5%8.4%
Standard Deviation (Sample)7.5%10.7%
Standard Deviation (Population)7.4%10.6%

Correlation Details

Czechoslovakian PercentileSample Size4 or more Vehicles in Household
[
0.0%
-
0.5%
]
0.078%
329,078,6996.5%
[
0.0%
-
0.5%
]
0.34%
28,255,0337.2%
[
0.5%
-
1.0%
]
0.60%
6,445,1828.0%
[
0.5%
-
1.0%
]
0.85%
2,019,4818.1%
[
1.0%
-
1.5%
]
1.11%
721,7438.6%
[
1.0%
-
1.5%
]
1.36%
485,8589.3%
[
1.5%
-
2.0%
]
1.61%
249,5459.9%
[
1.5%
-
2.0%
]
1.87%
130,7989.7%
[
2.0%
-
2.5%
]
2.11%
48,26813.2%
[
2.0%
-
2.5%
]
2.37%
38,55610.9%
[
2.5%
-
3.0%
]
2.58%
52,32712.6%
[
2.5%
-
3.0%
]
2.90%
31,5009.9%
[
3.0%
-
3.5%
]
3.08%
22,56311.1%
[
3.0%
-
3.5%
]
3.41%
29,0448.2%
[
3.5%
-
4.0%
]
3.66%
22,75012.1%
[
3.5%
-
4.0%
]
3.94%
11,8137.7%
[
4.0%
-
4.5%
]
4.09%
13,1336.2%
[
4.0%
-
4.5%
]
4.39%
8,26313.7%
[
4.5%
-
5.0%
]
4.63%
2,37513.7%
[
4.5%
-
5.0%
]
4.80%
4,64411.1%
[
5.0%
-
5.5%
]
5.16%
6,7628.8%
[
5.0%
-
5.5%
]
5.33%
3,62114.9%
[
5.5%
-
6.0%
]
5.64%
3,30014.2%
[
5.5%
-
6.0%
]
5.80%
1,9848.1%
[
6.0%
-
6.5%
]
6.16%
27618.1%
[
6.0%
-
6.5%
]
6.43%
3,32610.2%
[
6.5%
-
7.0%
]
6.72%
5,8656.7%
[
6.5%
-
7.0%
]
6.79%
1,7229.7%
[
7.0%
-
7.5%
]
7.11%
21120.0%
[
7.0%
-
7.5%
]
7.32%
16416.9%
[
7.5%
-
8.0%
]
7.69%
5215.4%
[
7.5%
-
8.0%
]
7.82%
3,6574.8%
[
8.0%
-
8.5%
]
8.20%
56110.6%
[
8.0%
-
8.5%
]
8.48%
1,88618.1%
[
9.0%
-
9.5%
]
9.09%
2233.3%
[
9.5%
-
10.0%
]
9.74%
15415.4%
[
9.5%
-
10.0%
]
9.75%
81010.4%
[
10.0%
-
10.5%
]
10.08%
1,41814.4%
[
10.0%
-
10.5%
]
10.50%
1,8108.5%
[
10.5%
-
11.0%
]
10.55%
41735.8%
[
10.5%
-
11.0%
]
10.92%
95216.3%
[
11.0%
-
11.5%
]
11.43%
1,5315.2%
[
11.5%
-
12.0%
]
11.86%
2,17524.1%
[
12.5%
-
13.0%
]
12.77%
37621.3%
[
13.0%
-
13.5%
]
13.50%
52618.4%
[
14.5%
-
15.0%
]
14.56%
6664.1%
[
15.0%
-
15.5%
]
15.25%
5918.2%
[
16.5%
-
17.0%
]
16.92%
59144.6%
[
17.0%
-
17.5%
]
17.09%
5154.7%
[
20.0%
-
20.5%
]
20.45%
48949.2%
[
27.0%
-
27.5%
]
27.05%
12254.2%
[
32.0%
-
32.5%
]
32.42%
2199.1%
[
35.0%
-
35.5%
]
35.46%
1415.5%