Czechoslovakian GED/Equivalency
COMPARE
Czechoslovakian
Select to Compare
GED/Equivalency
Czechoslovakian GED/Equivalency
87.4%
GED/EQUIVALENCY
97.6/ 100
METRIC RATING
96th/ 347
METRIC RANK
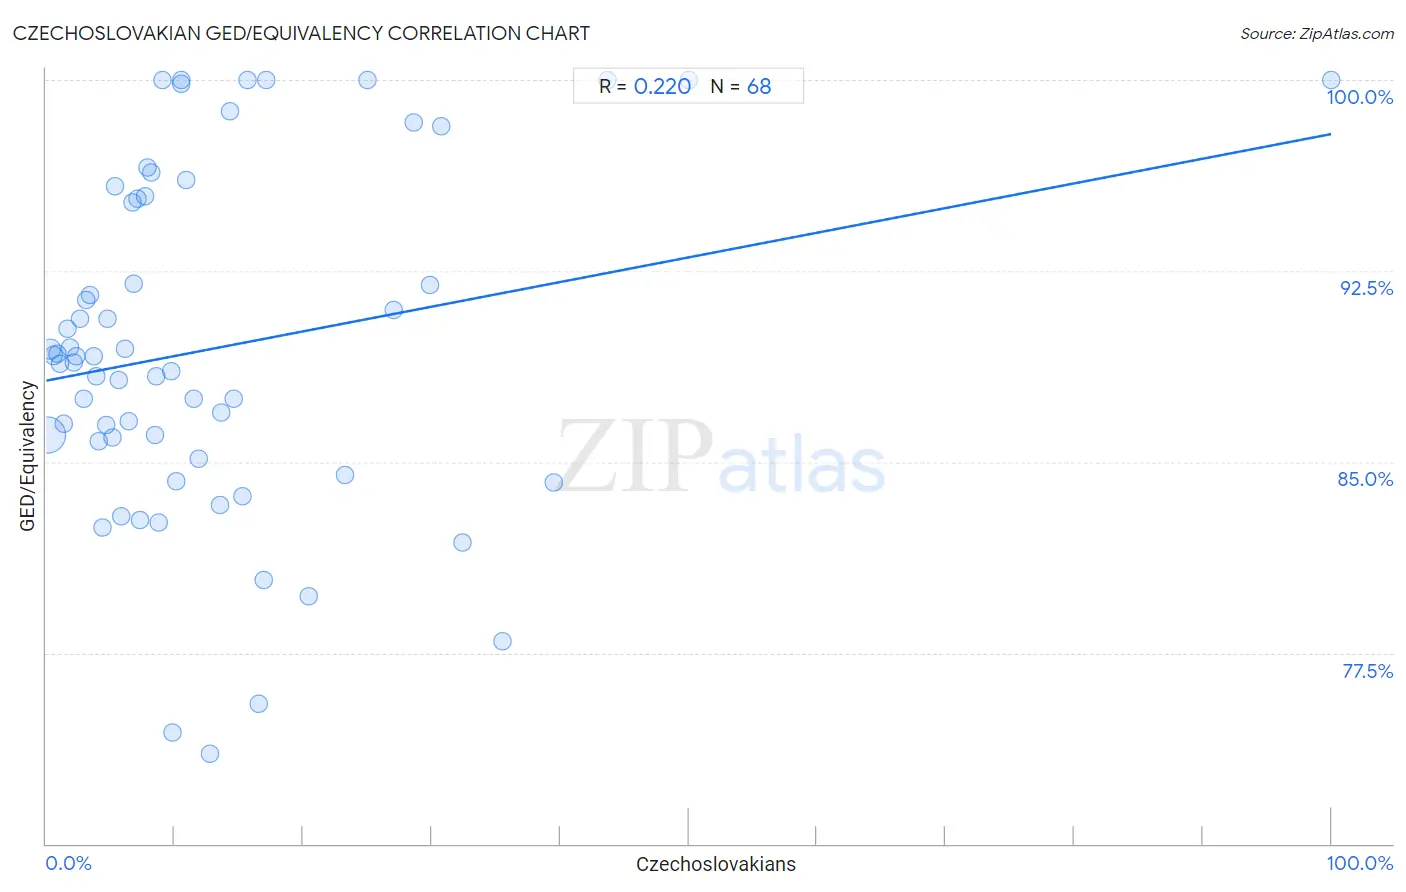
Czechoslovakian GED/Equivalency Correlation Chart
The statistical analysis conducted on geographies consisting of 368,668,598 people shows a weak positive correlation between the proportion of Czechoslovakians and percentage of population with at least ged/equivalency education in the United States with a correlation coefficient (R) of 0.220 and weighted average of 87.4%. On average, for every 1% (one percent) increase in Czechoslovakians within a typical geography, there is an increase of 0.097% in percentage of population with at least ged/equivalency education.
It is essential to understand that the correlation between the percentage of Czechoslovakians and percentage of population with at least ged/equivalency education does not imply a direct cause-and-effect relationship. It remains uncertain whether the presence of Czechoslovakians influences an upward or downward trend in the level of percentage of population with at least ged/equivalency education within an area, or if Czechoslovakians simply ended up residing in those areas with higher or lower levels of percentage of population with at least ged/equivalency education due to other factors.
Demographics Similar to Czechoslovakians by GED/Equivalency
In terms of ged/equivalency, the demographic groups most similar to Czechoslovakians are Immigrants from Greece (87.4%, a difference of 0.020%), Immigrants from Russia (87.4%, a difference of 0.030%), Israeli (87.4%, a difference of 0.040%), Immigrants from North Macedonia (87.4%, a difference of 0.040%), and Hungarian (87.4%, a difference of 0.060%).
| Demographics | Rating | Rank | GED/Equivalency |
| Hungarians | 97.9 /100 | #89 | Exceptional 87.4% |
| Welsh | 97.9 /100 | #90 | Exceptional 87.4% |
| Immigrants from Eastern Asia | 97.9 /100 | #91 | Exceptional 87.4% |
| Israelis | 97.8 /100 | #92 | Exceptional 87.4% |
| Immigrants from North Macedonia | 97.8 /100 | #93 | Exceptional 87.4% |
| Immigrants from Russia | 97.8 /100 | #94 | Exceptional 87.4% |
| Immigrants from Greece | 97.7 /100 | #95 | Exceptional 87.4% |
| Czechoslovakians | 97.6 /100 | #96 | Exceptional 87.4% |
| Immigrants from Western Europe | 97.3 /100 | #97 | Exceptional 87.3% |
| Immigrants from Croatia | 96.9 /100 | #98 | Exceptional 87.3% |
| Immigrants from Belarus | 96.9 /100 | #99 | Exceptional 87.3% |
| Palestinians | 96.8 /100 | #100 | Exceptional 87.3% |
| Syrians | 96.6 /100 | #101 | Exceptional 87.2% |
| Lebanese | 96.2 /100 | #102 | Exceptional 87.2% |
| Jordanians | 96.1 /100 | #103 | Exceptional 87.2% |
Czechoslovakian GED/Equivalency Correlation Summary
| Measurement | Czechoslovakian Data | GED/Equivalency Data |
| Minimum | 0.078% | 73.5% |
| Maximum | 100.0% | 100.0% |
| Range | 99.9% | 26.5% |
| Mean | 13.1% | 89.5% |
| Median | 8.5% | 89.0% |
| Interquartile 25% (IQ1) | 4.2% | 85.5% |
| Interquartile 75% (IQ3) | 15.5% | 95.4% |
| Interquartile Range (IQR) | 11.2% | 9.9% |
| Standard Deviation (Sample) | 15.3% | 6.7% |
| Standard Deviation (Population) | 15.2% | 6.7% |
Correlation Details
| Czechoslovakian Percentile | Sample Size | GED/Equivalency |
[ 0.0% - 0.5% ] 0.078% | 329,757,215 | 86.1% |
[ 0.0% - 0.5% ] 0.34% | 28,375,772 | 89.4% |
[ 0.5% - 1.0% ] 0.60% | 6,544,570 | 89.2% |
[ 0.5% - 1.0% ] 0.85% | 2,024,661 | 89.3% |
[ 1.0% - 1.5% ] 1.11% | 729,978 | 88.8% |
[ 1.0% - 1.5% ] 1.36% | 489,599 | 86.5% |
[ 1.5% - 2.0% ] 1.61% | 253,560 | 90.2% |
[ 1.5% - 2.0% ] 1.88% | 135,902 | 89.5% |
[ 2.0% - 2.5% ] 2.12% | 51,770 | 88.9% |
[ 2.0% - 2.5% ] 2.37% | 39,856 | 89.2% |
[ 2.5% - 3.0% ] 2.58% | 54,545 | 90.6% |
[ 2.5% - 3.0% ] 2.90% | 34,585 | 87.5% |
[ 3.0% - 3.5% ] 3.09% | 23,303 | 91.4% |
[ 3.0% - 3.5% ] 3.41% | 29,044 | 91.6% |
[ 3.5% - 4.0% ] 3.66% | 23,021 | 89.1% |
[ 3.5% - 4.0% ] 3.93% | 12,327 | 88.4% |
[ 4.0% - 4.5% ] 4.09% | 14,705 | 85.8% |
[ 4.0% - 4.5% ] 4.38% | 11,332 | 82.4% |
[ 4.5% - 5.0% ] 4.66% | 3,714 | 86.4% |
[ 4.5% - 5.0% ] 4.80% | 4,644 | 90.6% |
[ 5.0% - 5.5% ] 5.16% | 6,916 | 86.0% |
[ 5.0% - 5.5% ] 5.34% | 4,061 | 95.8% |
[ 5.5% - 6.0% ] 5.63% | 3,768 | 88.2% |
[ 5.5% - 6.0% ] 5.80% | 1,984 | 82.9% |
[ 6.0% - 6.5% ] 6.14% | 586 | 89.4% |
[ 6.0% - 6.5% ] 6.43% | 3,872 | 86.6% |
[ 6.5% - 7.0% ] 6.71% | 6,197 | 95.2% |
[ 6.5% - 7.0% ] 6.79% | 1,722 | 92.0% |
[ 7.0% - 7.5% ] 7.11% | 211 | 95.3% |
[ 7.0% - 7.5% ] 7.33% | 191 | 82.7% |
[ 7.5% - 8.0% ] 7.69% | 52 | 95.5% |
[ 7.5% - 8.0% ] 7.83% | 4,174 | 96.6% |
[ 8.0% - 8.5% ] 8.20% | 561 | 96.3% |
[ 8.0% - 8.5% ] 8.48% | 2,075 | 86.1% |
[ 8.5% - 9.0% ] 8.52% | 223 | 88.3% |
[ 8.5% - 9.0% ] 8.76% | 605 | 82.6% |
[ 9.0% - 9.5% ] 9.09% | 22 | 100.0% |
[ 9.5% - 10.0% ] 9.74% | 154 | 88.5% |
[ 9.5% - 10.0% ] 9.78% | 1,544 | 74.3% |
[ 10.0% - 10.5% ] 10.08% | 1,418 | 84.3% |
[ 10.0% - 10.5% ] 10.50% | 1,810 | 99.8% |
[ 10.5% - 11.0% ] 10.55% | 417 | 100.0% |
[ 10.5% - 11.0% ] 10.92% | 952 | 96.1% |
[ 11.0% - 11.5% ] 11.43% | 1,531 | 87.5% |
[ 11.5% - 12.0% ] 11.86% | 2,175 | 85.1% |
[ 12.5% - 13.0% ] 12.77% | 376 | 73.5% |
[ 13.0% - 13.5% ] 13.50% | 526 | 83.3% |
[ 13.5% - 14.0% ] 13.66% | 161 | 87.0% |
[ 14.0% - 14.5% ] 14.29% | 588 | 98.8% |
[ 14.5% - 15.0% ] 14.59% | 1,775 | 87.5% |
[ 15.0% - 15.5% ] 15.25% | 59 | 83.7% |
[ 15.5% - 16.0% ] 15.69% | 102 | 100.0% |
[ 16.5% - 17.0% ] 16.56% | 151 | 75.5% |
[ 16.5% - 17.0% ] 16.92% | 591 | 80.4% |
[ 17.0% - 17.5% ] 17.09% | 515 | 100.0% |
[ 20.0% - 20.5% ] 20.45% | 489 | 79.7% |
[ 23.0% - 23.5% ] 23.28% | 116 | 84.5% |
[ 25.0% - 25.5% ] 25.00% | 8 | 100.0% |
[ 27.0% - 27.5% ] 27.05% | 122 | 91.0% |
[ 28.5% - 29.0% ] 28.57% | 504 | 98.3% |
[ 29.5% - 30.0% ] 29.89% | 87 | 92.0% |
[ 30.5% - 31.0% ] 30.77% | 468 | 98.2% |
[ 32.0% - 32.5% ] 32.42% | 219 | 81.8% |
[ 35.0% - 35.5% ] 35.46% | 141 | 77.9% |
[ 39.0% - 39.5% ] 39.47% | 38 | 84.2% |
[ 43.5% - 44.0% ] 43.70% | 119 | 100.0% |
[ 50.0% - 50.5% ] 50.00% | 18 | 100.0% |
[ 99.5% - 100.0% ] 100.00% | 101 | 100.0% |