Czechoslovakian College, 1 year or more
COMPARE
Czechoslovakian
Select to Compare
College, 1 year or more
Czechoslovakian College, 1 year or more
59.4%
COLLEGE, 1 YEAR OR MORE
48.3/ 100
METRIC RATING
178th/ 347
METRIC RANK
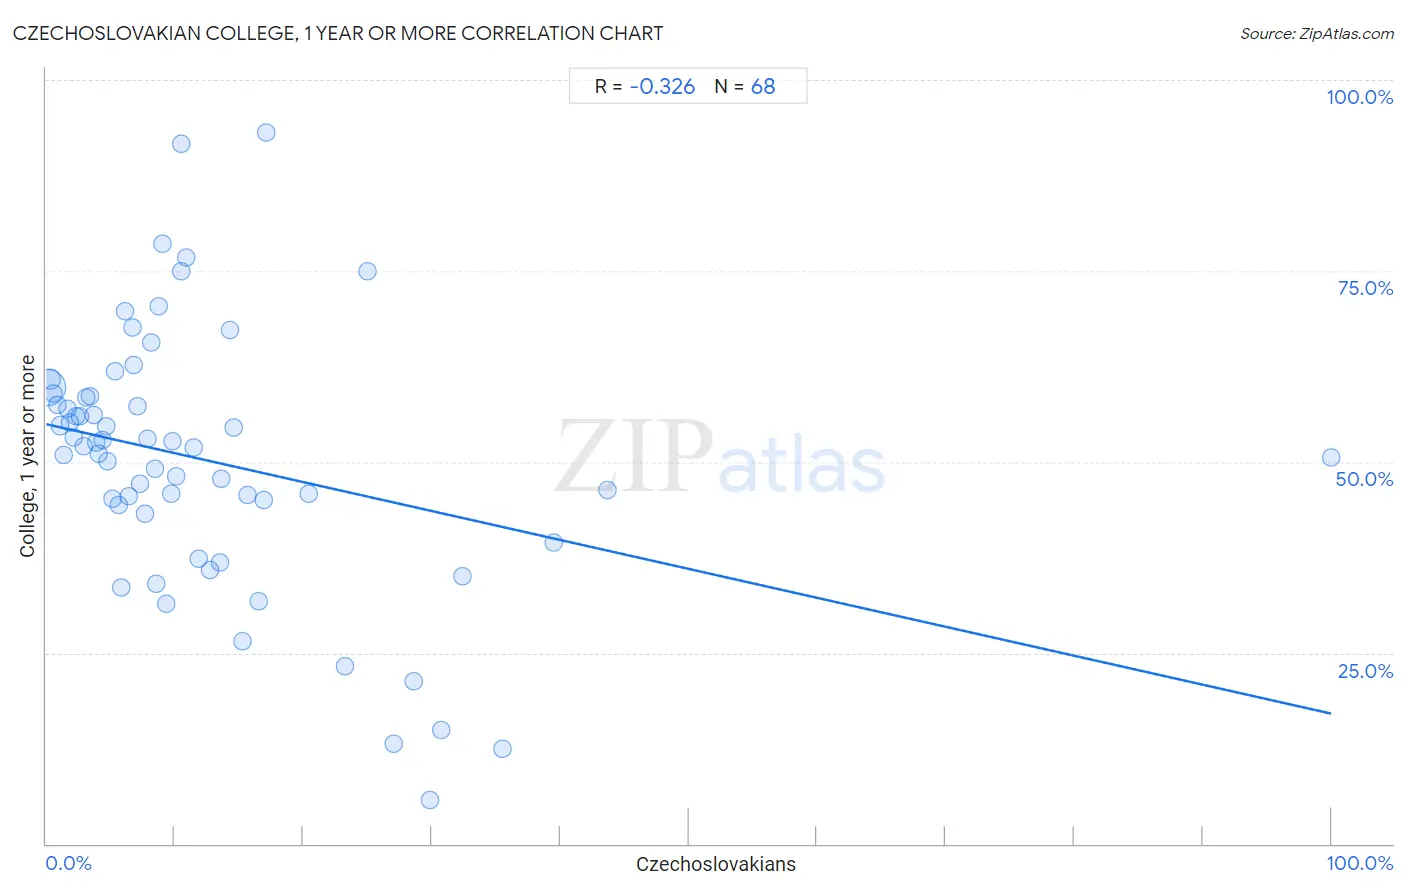
Czechoslovakian College, 1 year or more Correlation Chart
The statistical analysis conducted on geographies consisting of 368,667,186 people shows a mild negative correlation between the proportion of Czechoslovakians and percentage of population with at least college, 1 year or more education in the United States with a correlation coefficient (R) of -0.326 and weighted average of 59.4%. On average, for every 1% (one percent) increase in Czechoslovakians within a typical geography, there is a decrease of 0.38% in percentage of population with at least college, 1 year or more education.
It is essential to understand that the correlation between the percentage of Czechoslovakians and percentage of population with at least college, 1 year or more education does not imply a direct cause-and-effect relationship. It remains uncertain whether the presence of Czechoslovakians influences an upward or downward trend in the level of percentage of population with at least college, 1 year or more education within an area, or if Czechoslovakians simply ended up residing in those areas with higher or lower levels of percentage of population with at least college, 1 year or more education due to other factors.
Demographics Similar to Czechoslovakians by College, 1 year or more
In terms of college, 1 year or more, the demographic groups most similar to Czechoslovakians are Tlingit-Haida (59.4%, a difference of 0.0%), Immigrants from Poland (59.4%, a difference of 0.030%), Sri Lankan (59.4%, a difference of 0.040%), Celtic (59.4%, a difference of 0.090%), and Bermudan (59.3%, a difference of 0.090%).
| Demographics | Rating | Rank | College, 1 year or more |
| Immigrants from Albania | 52.3 /100 | #171 | Average 59.5% |
| Immigrants from Sierra Leone | 52.2 /100 | #172 | Average 59.5% |
| Immigrants from Oceania | 51.2 /100 | #173 | Average 59.4% |
| Celtics | 50.0 /100 | #174 | Average 59.4% |
| Sri Lankans | 49.0 /100 | #175 | Average 59.4% |
| Immigrants from Poland | 48.9 /100 | #176 | Average 59.4% |
| Tlingit-Haida | 48.4 /100 | #177 | Average 59.4% |
| Czechoslovakians | 48.3 /100 | #178 | Average 59.4% |
| Bermudans | 46.6 /100 | #179 | Average 59.3% |
| Yugoslavians | 44.1 /100 | #180 | Average 59.2% |
| Swiss | 43.4 /100 | #181 | Average 59.2% |
| Immigrants from Bosnia and Herzegovina | 42.8 /100 | #182 | Average 59.2% |
| German Russians | 39.3 /100 | #183 | Fair 59.1% |
| Spaniards | 38.3 /100 | #184 | Fair 59.0% |
| South Americans | 35.9 /100 | #185 | Fair 59.0% |
Czechoslovakian College, 1 year or more Correlation Summary
| Measurement | Czechoslovakian Data | College, 1 year or more Data |
| Minimum | 0.078% | 5.7% |
| Maximum | 100.0% | 93.1% |
| Range | 99.9% | 87.4% |
| Mean | 12.5% | 50.2% |
| Median | 8.5% | 52.0% |
| Interquartile 25% (IQ1) | 4.2% | 43.7% |
| Interquartile 75% (IQ3) | 14.9% | 58.5% |
| Interquartile Range (IQR) | 10.7% | 14.7% |
| Standard Deviation (Sample) | 14.7% | 17.1% |
| Standard Deviation (Population) | 14.6% | 16.9% |
Correlation Details
| Czechoslovakian Percentile | Sample Size | College, 1 year or more |
[ 0.0% - 0.5% ] 0.078% | 329,757,215 | 59.8% |
[ 0.0% - 0.5% ] 0.34% | 28,374,100 | 60.8% |
[ 0.5% - 1.0% ] 0.60% | 6,544,570 | 59.0% |
[ 0.5% - 1.0% ] 0.85% | 2,024,661 | 57.5% |
[ 1.0% - 1.5% ] 1.11% | 729,978 | 54.7% |
[ 1.0% - 1.5% ] 1.36% | 489,599 | 50.9% |
[ 1.5% - 2.0% ] 1.61% | 253,560 | 56.9% |
[ 1.5% - 2.0% ] 1.88% | 135,902 | 55.1% |
[ 2.0% - 2.5% ] 2.12% | 51,770 | 53.2% |
[ 2.0% - 2.5% ] 2.37% | 39,856 | 56.1% |
[ 2.5% - 3.0% ] 2.58% | 54,545 | 56.0% |
[ 2.5% - 3.0% ] 2.90% | 34,585 | 52.0% |
[ 3.0% - 3.5% ] 3.09% | 23,303 | 58.4% |
[ 3.0% - 3.5% ] 3.41% | 29,044 | 58.5% |
[ 3.5% - 4.0% ] 3.66% | 23,021 | 56.2% |
[ 3.5% - 4.0% ] 3.93% | 12,327 | 52.5% |
[ 4.0% - 4.5% ] 4.09% | 14,705 | 51.0% |
[ 4.0% - 4.5% ] 4.38% | 11,332 | 52.9% |
[ 4.5% - 5.0% ] 4.66% | 3,714 | 54.7% |
[ 4.5% - 5.0% ] 4.80% | 4,644 | 50.0% |
[ 5.0% - 5.5% ] 5.16% | 6,916 | 45.2% |
[ 5.0% - 5.5% ] 5.34% | 4,061 | 61.8% |
[ 5.5% - 6.0% ] 5.63% | 3,768 | 44.3% |
[ 5.5% - 6.0% ] 5.80% | 1,984 | 33.5% |
[ 6.0% - 6.5% ] 6.14% | 586 | 69.7% |
[ 6.0% - 6.5% ] 6.43% | 3,872 | 45.5% |
[ 6.5% - 7.0% ] 6.71% | 6,197 | 67.6% |
[ 6.5% - 7.0% ] 6.79% | 1,722 | 62.7% |
[ 7.0% - 7.5% ] 7.11% | 211 | 57.4% |
[ 7.0% - 7.5% ] 7.33% | 191 | 47.2% |
[ 7.5% - 8.0% ] 7.69% | 52 | 43.2% |
[ 7.5% - 8.0% ] 7.83% | 4,174 | 53.1% |
[ 8.0% - 8.5% ] 8.20% | 561 | 65.7% |
[ 8.0% - 8.5% ] 8.48% | 2,075 | 49.1% |
[ 8.5% - 9.0% ] 8.52% | 223 | 34.1% |
[ 8.5% - 9.0% ] 8.76% | 605 | 70.4% |
[ 9.0% - 9.5% ] 9.09% | 22 | 78.6% |
[ 9.0% - 9.5% ] 9.35% | 278 | 31.5% |
[ 9.5% - 10.0% ] 9.74% | 154 | 45.8% |
[ 9.5% - 10.0% ] 9.78% | 1,544 | 52.6% |
[ 10.0% - 10.5% ] 10.08% | 1,418 | 48.1% |
[ 10.0% - 10.5% ] 10.50% | 1,810 | 91.6% |
[ 10.5% - 11.0% ] 10.55% | 417 | 75.0% |
[ 10.5% - 11.0% ] 10.92% | 952 | 76.7% |
[ 11.0% - 11.5% ] 11.43% | 1,531 | 51.9% |
[ 11.5% - 12.0% ] 11.86% | 2,175 | 37.3% |
[ 12.5% - 13.0% ] 12.77% | 376 | 35.8% |
[ 13.0% - 13.5% ] 13.50% | 526 | 36.8% |
[ 13.5% - 14.0% ] 13.66% | 161 | 47.8% |
[ 14.0% - 14.5% ] 14.29% | 588 | 67.2% |
[ 14.5% - 15.0% ] 14.59% | 1,775 | 54.5% |
[ 15.0% - 15.5% ] 15.25% | 59 | 26.5% |
[ 15.5% - 16.0% ] 15.69% | 102 | 45.7% |
[ 16.5% - 17.0% ] 16.56% | 151 | 31.8% |
[ 16.5% - 17.0% ] 16.92% | 591 | 45.0% |
[ 17.0% - 17.5% ] 17.09% | 515 | 93.1% |
[ 20.0% - 20.5% ] 20.45% | 489 | 45.8% |
[ 23.0% - 23.5% ] 23.28% | 116 | 23.3% |
[ 25.0% - 25.5% ] 25.00% | 8 | 75.0% |
[ 27.0% - 27.5% ] 27.05% | 122 | 13.1% |
[ 28.5% - 29.0% ] 28.57% | 504 | 21.2% |
[ 29.5% - 30.0% ] 29.89% | 87 | 5.7% |
[ 30.5% - 31.0% ] 30.77% | 468 | 14.9% |
[ 32.0% - 32.5% ] 32.42% | 219 | 35.0% |
[ 35.0% - 35.5% ] 35.46% | 141 | 12.5% |
[ 39.0% - 39.5% ] 39.47% | 38 | 39.5% |
[ 43.5% - 44.0% ] 43.70% | 119 | 46.2% |
[ 99.5% - 100.0% ] 100.00% | 101 | 50.5% |