Czechoslovakian Unemployment Among Women with Children Ages 6 to 17 years

COMPARE

Czechoslovakian
Race
Ancestry
AfghanAfricanAlaska NativeAlaskan AthabascanAlbanianAleutAlsatianAmericanApacheArabArapahoArgentineanArmenianAssyrian/Chaldean/SyriacAustralianAustrianBahamianBangladeshiBarbadianBasqueBelgianBelizeanBermudanBhutaneseBlackfeetBolivianBrazilianBritishBritish West IndianBulgarianBurmeseCajunCambodianCanadianCape VerdeanCarpatho RusynCelticCentral AmericanCentral American IndianCherokeeCheyenneChickasawChileanChineseChippewaChoctawColombianColvilleComancheCosta RicanCreeCreekCroatianCrowCubanCypriotCzechCzechoslovakianDanishDelawareDominicanDutchDutch West IndianEastern EuropeanEcuadorianEgyptianEnglishEstonianEthiopianEuropeanFijianFilipinoFinnishFrenchFrench American IndianFrench CanadianGermanGerman RussianGhanaianGreekGuamanian/ChamorroGuatemalanGuyaneseHaitianHmongHonduranHopiHoumaHungarianIcelanderIndian (Asian)IndonesianInupiatIranianIraqiIrishIroquoisIsraeliItalianJamaicanJapaneseJordanianKenyanKiowaKoreanLaotianLatvianLebaneseLiberianLithuanianLumbeeLuxembourgerMacedonianMalaysianMalteseMarshalleseMenomineeMexicanMexican American IndianMongolianMoroccanNative HawaiianNavajoNepaleseNew ZealanderNicaraguanNigerianNorthern EuropeanNorwegianOkinawanOsageOttawaPaiutePakistaniPalestinianPanamanianParaguayanPennsylvania GermanPeruvianPimaPolishPortuguesePotawatomiPuebloPuerto RicanPuget Sound SalishRomanianRussianSalvadoranSamoanScandinavianScotch-IrishScottishSeminoleSenegaleseSerbianShoshoneSierra LeoneanSiouxSlavicSlovakSloveneSomaliSouth AfricanSouth AmericanSouth American IndianSoviet UnionSpaniardSpanishSpanish AmericanSpanish American IndianSri LankanSubsaharan AfricanSudaneseSwedishSwissSyrianTaiwaneseThaiTlingit-HaidaTohono O'OdhamTonganTrinidadian and TobagonianTsimshianTurkishU.S. Virgin IslanderUgandanUkrainianUruguayanUteVenezuelanVietnameseWelshWest IndianYakamaYaquiYugoslavianYumanYup'ikZimbabwean
Immigration
NonimmigrantsImmigrantsAfghanistanAfricaAlbaniaArgentinaArmeniaAsiaAustraliaAustriaBahamasBangladeshBarbadosBelarusBelgiumBelizeBoliviaBosnia and HerzegovinaBrazilBulgariaBurma/MyanmarCabo VerdeCambodiaCameroonCanadaCaribbeanCentral AmericaChileChinaColombiaCongoCosta RicaCroatiaCubaCzechoslovakiaDenmarkDominicaDominican RepublicEastern AfricaEastern AsiaEastern EuropeEcuadorEgyptEl SalvadorEnglandEritreaEthiopiaEuropeFijiFranceGermanyGhanaGreeceGrenadaGuatemalaGuyanaHaitiHondurasHong KongHungaryIndiaIndonesiaIranIraqIrelandIsraelItalyJamaicaJapanJordanKazakhstanKenyaKoreaKuwaitLaosLatin AmericaLatviaLebanonLiberiaLithuaniaMalaysiaMexicoMicronesiaMiddle AfricaMoldovaMoroccoNepalNetherlandsNicaraguaNigeriaNorth AmericaNorth MacedoniaNorthern AfricaNorthern EuropeNorwayOceaniaPakistanPanamaPeruPhilippinesPolandPortugalRomaniaRussiaSaudi ArabiaScotlandSenegalSerbiaSierra LeoneSingaporeSomaliaSouth AfricaSouth AmericaSouth Central AsiaSouth Eastern AsiaSouthern EuropeSpainSri LankaSt. Vincent and the GrenadinesSudanSwedenSwitzerlandSyriaTaiwanThailandTrinidad and TobagoTurkeyUgandaUkraineUruguayUzbekistanVenezuelaVietnamWest IndiesWestern AfricaWestern AsiaWestern EuropeYemenZaireZimbabweAzores
Select to Compare
Race
Ancestry
AfghanAfricanAlaska NativeAlaskan AthabascanAlbanianAleutAlsatianAmericanApacheArabArapahoArgentineanArmenianAssyrian/Chaldean/SyriacAustralianAustrianBahamianBangladeshiBarbadianBasqueBelgianBelizeanBermudanBhutaneseBlackfeetBolivianBrazilianBritishBritish West IndianBulgarianBurmeseCajunCambodianCanadianCape VerdeanCarpatho RusynCelticCentral AmericanCentral American IndianCherokeeCheyenneChickasawChileanChineseChippewaChoctawColombianColvilleComancheCosta RicanCreeCreekCroatianCrowCubanCypriotCzechDanishDelawareDominicanDutchDutch West IndianEastern EuropeanEcuadorianEgyptianEnglishEstonianEthiopianEuropeanFijianFilipinoFinnishFrenchFrench American IndianFrench CanadianGermanGerman RussianGhanaianGreekGuamanian/ChamorroGuatemalanGuyaneseHaitianHmongHonduranHopiHoumaHungarianIcelanderIndian (Asian)IndonesianInupiatIranianIraqiIrishIroquoisIsraeliItalianJamaicanJapaneseJordanianKenyanKiowaKoreanLaotianLatvianLebaneseLiberianLithuanianLumbeeLuxembourgerMacedonianMalaysianMalteseMarshalleseMenomineeMexicanMexican American IndianMongolianMoroccanNative HawaiianNavajoNepaleseNew ZealanderNicaraguanNigerianNorthern EuropeanNorwegianOkinawanOsageOttawaPaiutePakistaniPalestinianPanamanianParaguayanPennsylvania GermanPeruvianPimaPolishPortuguesePotawatomiPuebloPuerto RicanPuget Sound SalishRomanianRussianSalvadoranSamoanScandinavianScotch-IrishScottishSeminoleSenegaleseSerbianShoshoneSierra LeoneanSiouxSlavicSlovakSloveneSomaliSouth AfricanSouth AmericanSouth American IndianSoviet UnionSpaniardSpanishSpanish AmericanSpanish American IndianSri LankanSubsaharan AfricanSudaneseSwedishSwissSyrianTaiwaneseThaiTlingit-HaidaTohono O'OdhamTonganTrinidadian and TobagonianTsimshianTurkishU.S. Virgin IslanderUgandanUkrainianUruguayanUteVenezuelanVietnameseWelshWest IndianYakamaYaquiYugoslavianYumanYup'ikZimbabwean
Immigration
NonimmigrantsImmigrantsAfghanistanAfricaAlbaniaArgentinaArmeniaAsiaAustraliaAustriaBahamasBangladeshBarbadosBelarusBelgiumBelizeBoliviaBosnia and HerzegovinaBrazilBulgariaBurma/MyanmarCabo VerdeCambodiaCameroonCanadaCaribbeanCentral AmericaChileChinaColombiaCongoCosta RicaCroatiaCubaCzechoslovakiaDenmarkDominicaDominican RepublicEastern AfricaEastern AsiaEastern EuropeEcuadorEgyptEl SalvadorEnglandEritreaEthiopiaEuropeFijiFranceGermanyGhanaGreeceGrenadaGuatemalaGuyanaHaitiHondurasHong KongHungaryIndiaIndonesiaIranIraqIrelandIsraelItalyJamaicaJapanJordanKazakhstanKenyaKoreaKuwaitLaosLatin AmericaLatviaLebanonLiberiaLithuaniaMalaysiaMexicoMicronesiaMiddle AfricaMoldovaMoroccoNepalNetherlandsNicaraguaNigeriaNorth AmericaNorth MacedoniaNorthern AfricaNorthern EuropeNorwayOceaniaPakistanPanamaPeruPhilippinesPolandPortugalRomaniaRussiaSaudi ArabiaScotlandSenegalSerbiaSierra LeoneSingaporeSomaliaSouth AfricaSouth AmericaSouth Central AsiaSouth Eastern AsiaSouthern EuropeSpainSri LankaSt. Vincent and the GrenadinesSudanSwedenSwitzerlandSyriaTaiwanThailandTrinidad and TobagoTurkeyUgandaUkraineUruguayUzbekistanVenezuelaVietnamWest IndiesWestern AfricaWestern AsiaWestern EuropeYemenZaireZimbabweAzores
Unemployment Among Women with Children Ages 6 to 17 years
Income
Poverty
Unemployment
Labor Participation
Family Structure
Vehicle Availability
Education Level
Disability

Czechoslovakian Unemployment Among Women with Children Ages 6 to 17 years
Fair

9.1%
UNEMPLOYMENT | WOMEN W/ CHILDREN 6 TO 17
20.8/ 100
METRIC RATING
199th/ 347
METRIC RANK

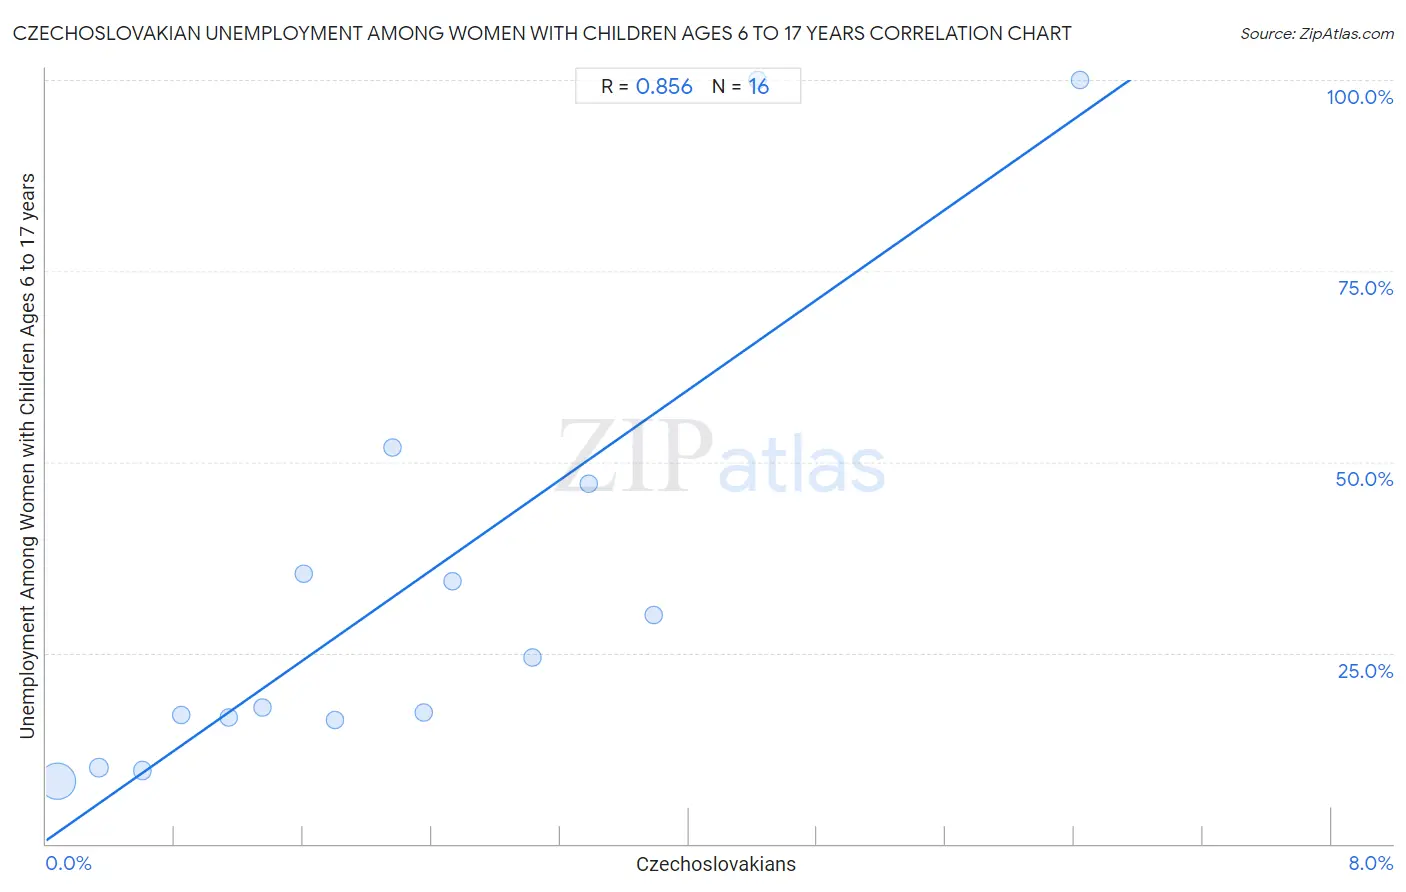
Czechoslovakian Unemployment Among Women with Children Ages 6 to 17 years Correlation Chart

The statistical analysis conducted on geographies consisting of 258,773,734 people shows a very strong positive correlation between the proportion of Czechoslovakians and unemployment rate among women with children between the ages 6 and 17 in the United States with a correlation coefficient (R) of 0.856 and weighted average of 9.1%. On average, for every 1% (one percent) increase in Czechoslovakians within a typical geography, there is an increase of 14.8% in unemployment rate among women with children between the ages 6 and 17.
Czechoslovakian Unemployment Among Women with Children Ages 6 to 17 years
It is essential to understand that the correlation between the percentage of Czechoslovakians and unemployment rate among women with children between the ages 6 and 17 does not imply a direct cause-and-effect relationship. It remains uncertain whether the presence of Czechoslovakians influences an upward or downward trend in the level of unemployment rate among women with children between the ages 6 and 17 within an area, or if Czechoslovakians simply ended up residing in those areas with higher or lower levels of unemployment rate among women with children between the ages 6 and 17 due to other factors.

Demographics Similar to Czechoslovakians by Unemployment Among Women with Children Ages 6 to 17 years

In terms of unemployment among women with children ages 6 to 17 years, the demographic groups most similar to Czechoslovakians are Guyanese (9.1%, a difference of 0.070%), Trinidadian and Tobagonian (9.1%, a difference of 0.18%), Immigrants from Panama (9.1%, a difference of 0.22%), Brazilian (9.1%, a difference of 0.23%), and Austrian (9.1%, a difference of 0.26%).
DemographicsRating | RankUnemployment Among Women with Children Ages 6 to 17 years
Guamanians/Chamorros
27.2
/100
|
#192
Fair
9.1%
Immigrants from Turkey
25.8
/100
|
#193
Fair
9.1%
Immigrants from Kazakhstan
25.3
/100
|
#194
Fair
9.1%
Austrians
25.0
/100
|
#195
Fair
9.1%
Brazilians
24.4
/100
|
#196
Fair
9.1%
Immigrants from Panama
24.3
/100
|
#197
Fair
9.1%
Guyanese
21.8
/100
|
#198
Fair
9.1%
Czechoslovakians
20.8
/100
|
#199
Fair
9.1%
Trinidadians and Tobagonians
18.2
/100
|
#200
Poor
9.1%
Immigrants from Trinidad and Tobago
16.7
/100
|
#201
Poor
9.1%
Immigrants from Middle Africa
15.6
/100
|
#202
Poor
9.1%
Maltese
15.3
/100
|
#203
Poor
9.1%
Immigrants from Canada
15.3
/100
|
#204
Poor
9.1%
Immigrants from Western Europe
14.1
/100
|
#205
Poor
9.1%
Immigrants from North America
12.7
/100
|
#206
Poor
9.2%

Czechoslovakian Unemployment Among Women with Children Ages 6 to 17 years Correlation Summary

MeasurementCzechoslovakian DataUnemployment Among Women with Children Ages 6 to 17 years Data
Minimum0.071%8.3%
Maximum6.4%100.0%
Range6.4%91.7%
Mean2.2%33.5%
Median2.0%21.1%
Interquartile 25% (IQ1)0.99%16.3%
Interquartile 75% (IQ3)3.2%41.2%
Interquartile Range (IQR)2.2%24.9%
Standard Deviation (Sample)1.7%29.0%
Standard Deviation (Population)1.6%28.1%

Correlation Details

Czechoslovakian PercentileSample SizeUnemployment Among Women with Children Ages 6 to 17 years
[
0.0%
-
0.5%
]
0.071%
243,399,2648.3%
[
0.0%
-
0.5%
]
0.33%
11,797,3409.9%
[
0.5%
-
1.0%
]
0.60%
2,657,0209.6%
[
0.5%
-
1.0%
]
0.84%
567,76616.8%
[
1.0%
-
1.5%
]
1.13%
138,56716.5%
[
1.0%
-
1.5%
]
1.34%
117,52817.9%
[
1.5%
-
2.0%
]
1.60%
48,99335.3%
[
1.5%
-
2.0%
]
1.80%
26,10216.2%
[
2.0%
-
2.5%
]
2.15%
5,61651.9%
[
2.0%
-
2.5%
]
2.35%
1,36217.2%
[
2.5%
-
3.0%
]
2.53%
7,94134.4%
[
3.0%
-
3.5%
]
3.03%
2,37624.3%
[
3.0%
-
3.5%
]
3.37%
2,43047.2%
[
3.5%
-
4.0%
]
3.78%
42330.0%
[
4.0%
-
4.5%
]
4.43%
835100.0%
[
6.0%
-
6.5%
]
6.43%
171100.0%