Zip Codes with the Highest Percentage of Population with a Degree in Physical and Health Sciences in New Mexico
RELATED REPORTS & OPTIONS
Physical and Health Sciences
New Mexico
Compare Zip Codes
Map of Zip Codes with the Highest Percentage of Population with a Degree in Physical and Health Sciences in New Mexico
0.0%
100.0%
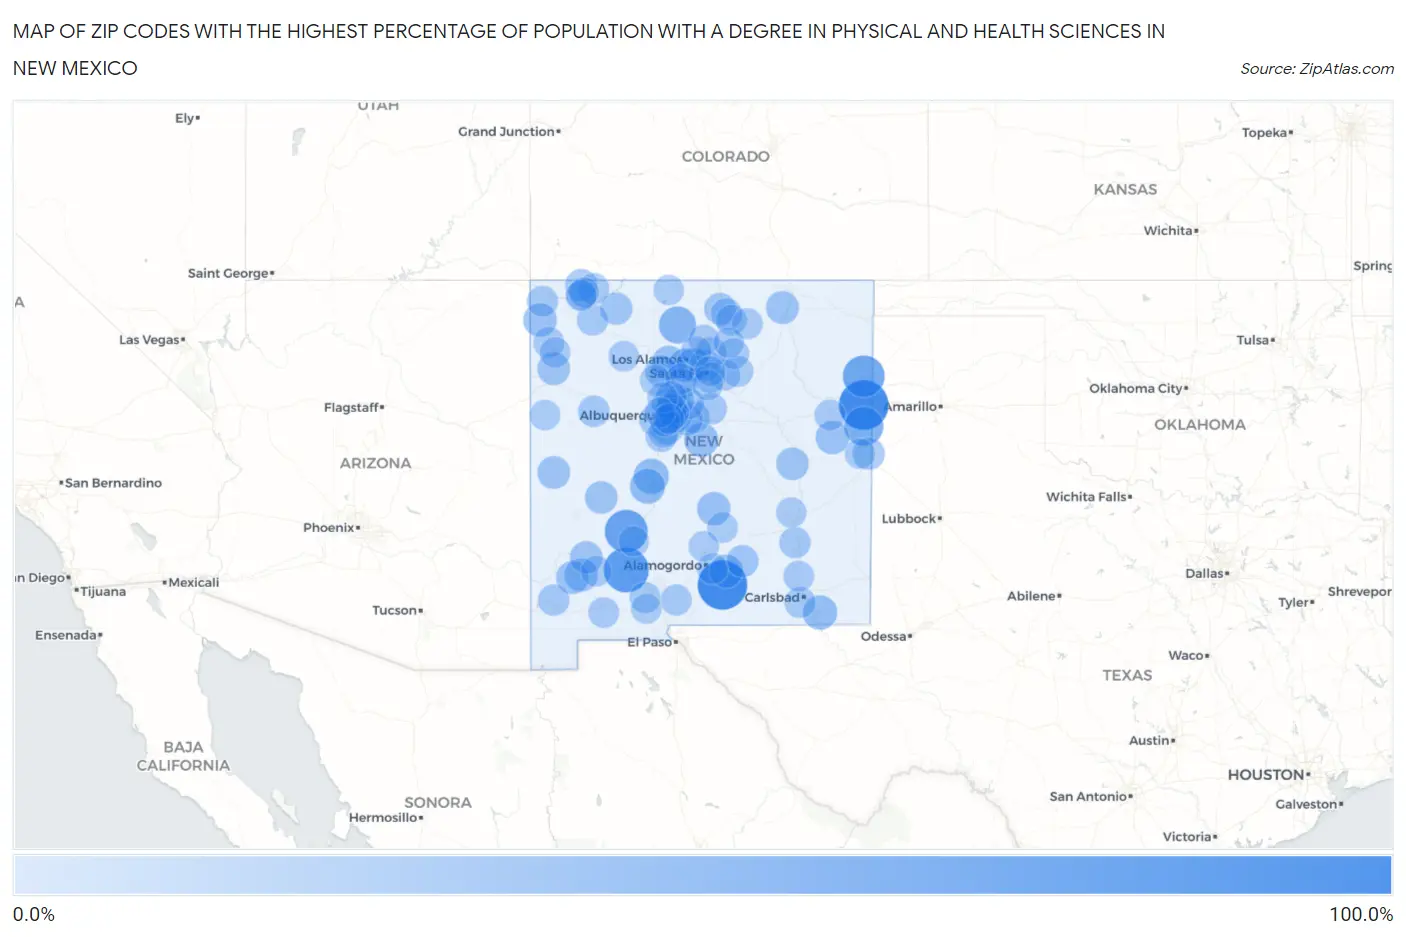
Zip Codes with the Highest Percentage of Population with a Degree in Physical and Health Sciences in New Mexico
| Zip Code | % Graduates | vs State | vs National | |
| 1. | 88411 | 100.0% | 4.8% (+95.2)#1 | 3.1% (+96.9)#11 |
| 2. | 88350 | 100.0% | 4.8% (+95.2)#2 | 3.1% (+96.9)#13 |
| 3. | 87930 | 76.7% | 4.8% (+71.8)#3 | 3.1% (+73.6)#31 |
| 4. | 87939 | 65.9% | 4.8% (+61.0)#4 | 3.1% (+62.8)#40 |
| 5. | 88430 | 60.0% | 4.8% (+55.2)#5 | 3.1% (+56.9)#42 |
| 6. | 88112 | 47.3% | 4.8% (+42.5)#6 | 3.1% (+44.2)#80 |
| 7. | 87510 | 37.1% | 4.8% (+32.3)#7 | 3.1% (+34.0)#121 |
| 8. | 87828 | 26.9% | 4.8% (+22.1)#8 | 3.1% (+23.8)#231 |
| 9. | 87801 | 26.4% | 4.8% (+21.6)#9 | 3.1% (+23.3)#243 |
| 10. | 88256 | 23.2% | 4.8% (+18.3)#10 | 3.1% (+20.1)#310 |
| 11. | 87016 | 21.9% | 4.8% (+17.1)#11 | 3.1% (+18.8)#353 |
| 12. | 87025 | 19.8% | 4.8% (+15.0)#12 | 3.1% (+16.7)#414 |
| 13. | 87461 | 19.4% | 4.8% (+14.6)#13 | 3.1% (+16.3)#428 |
| 14. | 88427 | 19.2% | 4.8% (+14.4)#14 | 3.1% (+16.1)#436 |
| 15. | 88317 | 18.8% | 4.8% (+14.0)#15 | 3.1% (+15.7)#455 |
| 16. | 88301 | 18.3% | 4.8% (+13.5)#16 | 3.1% (+15.2)#479 |
| 17. | 87544 | 18.0% | 4.8% (+13.2)#17 | 3.1% (+14.9)#497 |
| 18. | 88026 | 17.8% | 4.8% (+13.0)#18 | 3.1% (+14.7)#508 |
| 19. | 87547 | 16.8% | 4.8% (+12.0)#19 | 3.1% (+13.7)#550 |
| 20. | 87728 | 16.7% | 4.8% (+11.8)#20 | 3.1% (+13.6)#559 |
| 21. | 88065 | 16.5% | 4.8% (+11.7)#21 | 3.1% (+13.4)#580 |
| 22. | 87829 | 15.4% | 4.8% (+10.5)#22 | 3.1% (+12.3)#635 |
| 23. | 87310 | 15.2% | 4.8% (+10.3)#23 | 3.1% (+12.1)#658 |
| 24. | 88049 | 14.7% | 4.8% (+9.84)#24 | 3.1% (+11.6)#694 |
| 25. | 87825 | 14.4% | 4.8% (+9.52)#25 | 3.1% (+11.3)#724 |
| 26. | 88119 | 14.3% | 4.8% (+9.44)#26 | 3.1% (+11.2)#730 |
| 27. | 87412 | 13.7% | 4.8% (+8.82)#27 | 3.1% (+10.6)#805 |
| 28. | 87024 | 12.5% | 4.8% (+7.71)#28 | 3.1% (+9.45)#935 |
| 29. | 88339 | 12.3% | 4.8% (+7.50)#29 | 3.1% (+9.25)#967 |
| 30. | 88135 | 11.9% | 4.8% (+7.03)#30 | 3.1% (+8.78)#1,018 |
| 31. | 87418 | 11.5% | 4.8% (+6.62)#31 | 3.1% (+8.36)#1,085 |
| 32. | 87116 | 10.7% | 4.8% (+5.91)#32 | 3.1% (+7.65)#1,214 |
| 33. | 87513 | 10.5% | 4.8% (+5.62)#33 | 3.1% (+7.37)#1,264 |
| 34. | 87151 | 10.0% | 4.8% (+5.16)#34 | 3.1% (+6.90)#1,359 |
| 35. | 87068 | 9.7% | 4.8% (+4.82)#35 | 3.1% (+6.56)#1,452 |
| 36. | 87015 | 9.6% | 4.8% (+4.79)#36 | 3.1% (+6.53)#1,462 |
| 37. | 87056 | 9.4% | 4.8% (+4.61)#37 | 3.1% (+6.35)#1,514 |
| 38. | 87020 | 9.1% | 4.8% (+4.27)#38 | 3.1% (+6.01)#1,614 |
| 39. | 87031 | 9.1% | 4.8% (+4.22)#39 | 3.1% (+5.96)#1,645 |
| 40. | 88045 | 8.9% | 4.8% (+4.08)#40 | 3.1% (+5.82)#1,693 |
| 41. | 88230 | 8.6% | 4.8% (+3.80)#41 | 3.1% (+5.55)#1,782 |
| 42. | 87506 | 8.4% | 4.8% (+3.57)#42 | 3.1% (+5.31)#1,864 |
| 43. | 87731 | 8.3% | 4.8% (+3.43)#43 | 3.1% (+5.18)#1,908 |
| 44. | 87413 | 8.0% | 4.8% (+3.19)#44 | 3.1% (+4.93)#2,006 |
| 45. | 87123 | 7.9% | 4.8% (+3.04)#45 | 3.1% (+4.78)#2,064 |
| 46. | 87514 | 7.8% | 4.8% (+3.01)#46 | 3.1% (+4.75)#2,074 |
| 47. | 87059 | 7.7% | 4.8% (+2.87)#47 | 3.1% (+4.61)#2,136 |
| 48. | 87410 | 7.6% | 4.8% (+2.80)#48 | 3.1% (+4.54)#2,178 |
| 49. | 87052 | 7.3% | 4.8% (+2.45)#49 | 3.1% (+4.19)#2,359 |
| 50. | 87122 | 7.3% | 4.8% (+2.44)#50 | 3.1% (+4.18)#2,364 |
| 51. | 88002 | 7.1% | 4.8% (+2.30)#51 | 3.1% (+4.04)#2,431 |
| 52. | 87047 | 7.1% | 4.8% (+2.26)#52 | 3.1% (+4.01)#2,455 |
| 53. | 88007 | 6.8% | 4.8% (+1.95)#53 | 3.1% (+3.69)#2,635 |
| 54. | 88220 | 6.7% | 4.8% (+1.90)#54 | 3.1% (+3.64)#2,669 |
| 55. | 87109 | 6.6% | 4.8% (+1.79)#55 | 3.1% (+3.53)#2,749 |
| 56. | 87420 | 6.5% | 4.8% (+1.68)#56 | 3.1% (+3.42)#2,809 |
| 57. | 88401 | 6.4% | 4.8% (+1.55)#57 | 3.1% (+3.29)#2,915 |
| 58. | 87043 | 6.3% | 4.8% (+1.46)#58 | 3.1% (+3.20)#2,991 |
| 59. | 87552 | 6.2% | 4.8% (+1.41)#59 | 3.1% (+3.15)#3,032 |
| 60. | 87364 | 6.2% | 4.8% (+1.41)#60 | 3.1% (+3.15)#3,034 |
| 61. | 87111 | 6.2% | 4.8% (+1.38)#61 | 3.1% (+3.12)#3,063 |
| 62. | 88325 | 6.2% | 4.8% (+1.31)#62 | 3.1% (+3.05)#3,126 |
| 63. | 87732 | 5.9% | 4.8% (+1.04)#63 | 3.1% (+2.78)#3,375 |
| 64. | 87571 | 5.8% | 4.8% (+0.929)#64 | 3.1% (+2.67)#3,491 |
| 65. | 87072 | 5.8% | 4.8% (+0.928)#65 | 3.1% (+2.67)#3,498 |
| 66. | 88030 | 5.8% | 4.8% (+0.914)#66 | 3.1% (+2.66)#3,506 |
| 67. | 87113 | 5.7% | 4.8% (+0.809)#67 | 3.1% (+2.55)#3,620 |
| 68. | 87710 | 5.6% | 4.8% (+0.804)#68 | 3.1% (+2.55)#3,628 |
| 69. | 87522 | 5.6% | 4.8% (+0.798)#69 | 3.1% (+2.54)#3,637 |
| 70. | 87108 | 5.6% | 4.8% (+0.712)#70 | 3.1% (+2.45)#3,763 |
| 71. | 88041 | 5.5% | 4.8% (+0.642)#71 | 3.1% (+2.38)#3,848 |
| 72. | 88210 | 5.4% | 4.8% (+0.600)#72 | 3.1% (+2.34)#3,904 |
| 73. | 87582 | 5.3% | 4.8% (+0.504)#73 | 3.1% (+2.25)#4,018 |
| 74. | 87013 | 5.3% | 4.8% (+0.422)#74 | 3.1% (+2.16)#4,128 |
| 75. | 88312 | 5.3% | 4.8% (+0.416)#75 | 3.1% (+2.16)#4,152 |
| 76. | 87325 | 4.9% | 4.8% (+0.076)#76 | 3.1% (+1.82)#4,717 |
| 77. | 87579 | 4.8% | 4.8% (-0.080)#77 | 3.1% (+1.66)#5,000 |
| 78. | 87048 | 4.7% | 4.8% (-0.154)#78 | 3.1% (+1.59)#5,140 |
| 79. | 87935 | 4.7% | 4.8% (-0.159)#79 | 3.1% (+1.58)#5,151 |
| 80. | 87042 | 4.5% | 4.8% (-0.309)#80 | 3.1% (+1.43)#5,471 |
| 81. | 87505 | 4.5% | 4.8% (-0.313)#81 | 3.1% (+1.43)#5,476 |
| 82. | 88352 | 4.5% | 4.8% (-0.339)#82 | 3.1% (+1.40)#5,530 |
| 83. | 87053 | 4.4% | 4.8% (-0.397)#83 | 3.1% (+1.34)#5,653 |
| 84. | 87401 | 4.4% | 4.8% (-0.483)#84 | 3.1% (+1.26)#5,837 |
| 85. | 87508 | 4.3% | 4.8% (-0.499)#85 | 3.1% (+1.24)#5,877 |
| 86. | 87112 | 4.3% | 4.8% (-0.507)#86 | 3.1% (+1.24)#5,891 |
| 87. | 87004 | 4.2% | 4.8% (-0.647)#87 | 3.1% (+1.09)#6,224 |
| 88. | 87402 | 4.1% | 4.8% (-0.697)#88 | 3.1% (+1.04)#6,340 |
| 89. | 87327 | 4.1% | 4.8% (-0.746)#89 | 3.1% (+0.996)#6,480 |
| 90. | 87105 | 4.0% | 4.8% (-0.869)#90 | 3.1% (+0.872)#6,838 |
| 91. | 87144 | 3.9% | 4.8% (-0.933)#91 | 3.1% (+0.809)#7,020 |
| 92. | 88101 | 3.9% | 4.8% (-0.949)#92 | 3.1% (+0.793)#7,062 |
| 93. | 87120 | 3.8% | 4.8% (-1.01)#93 | 3.1% (+0.730)#7,266 |
| 94. | 87520 | 3.8% | 4.8% (-1.02)#94 | 3.1% (+0.725)#7,281 |
| 95. | 87106 | 3.8% | 4.8% (-1.03)#95 | 3.1% (+0.708)#7,337 |
| 96. | 88201 | 3.8% | 4.8% (-1.04)#96 | 3.1% (+0.697)#7,383 |
| 97. | 87532 | 3.8% | 4.8% (-1.05)#97 | 3.1% (+0.693)#7,397 |
| 98. | 88005 | 3.8% | 4.8% (-1.08)#98 | 3.1% (+0.657)#7,505 |
| 99. | 87415 | 3.7% | 4.8% (-1.18)#99 | 3.1% (+0.563)#7,837 |
| 100. | 87501 | 3.6% | 4.8% (-1.22)#100 | 3.1% (+0.518)#7,996 |
Common Questions
What are the Top 10 Zip Codes with the Highest Percentage of Population with a Degree in Physical and Health Sciences in New Mexico?
Top 10 Zip Codes with the Highest Percentage of Population with a Degree in Physical and Health Sciences in New Mexico are:
What zip code has the Highest Percentage of Population with a Degree in Physical and Health Sciences in New Mexico?
88411 has the Highest Percentage of Population with a Degree in Physical and Health Sciences in New Mexico with 100.0%.
What is the Percentage of Population with a Degree in Physical and Health Sciences in the State of New Mexico?
Percentage of Population with a Degree in Physical and Health Sciences in New Mexico is 4.8%.
What is the Percentage of Population with a Degree in Physical and Health Sciences in the United States?
Percentage of Population with a Degree in Physical and Health Sciences in the United States is 3.1%.