Zip Codes with the Highest Percentage of Population with a Degree in Physical and Health Sciences in Alaska
RELATED REPORTS & OPTIONS
Physical and Health Sciences
Alaska
Compare Zip Codes
Map of Zip Codes with the Highest Percentage of Population with a Degree in Physical and Health Sciences in Alaska
0.0%
80.0%
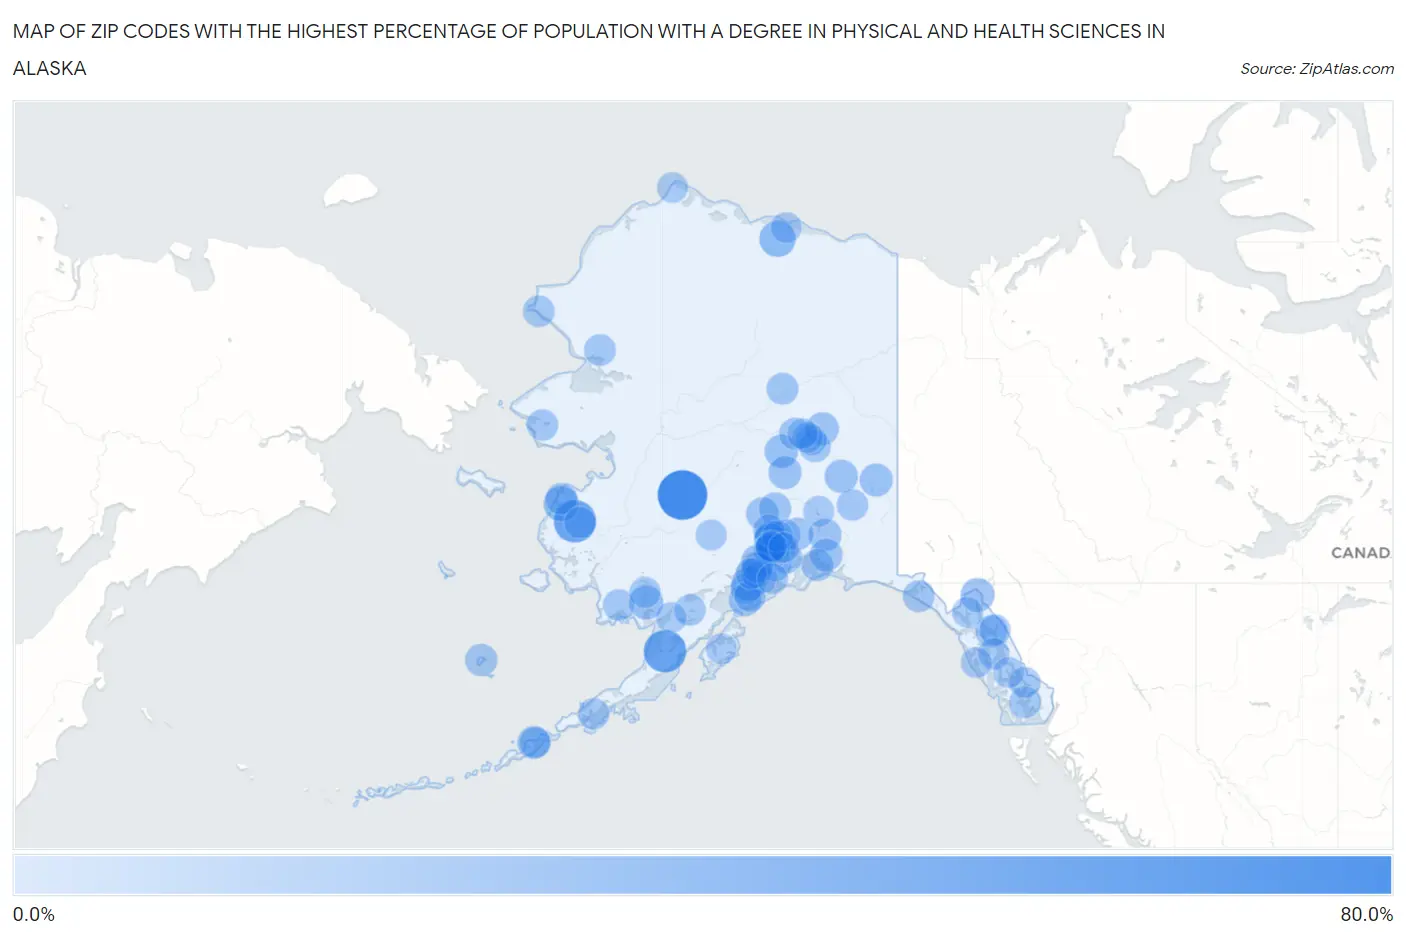
Zip Codes with the Highest Percentage of Population with a Degree in Physical and Health Sciences in Alaska
| Zip Code | % Graduates | vs State | vs National | |
| 1. | 99675 | 80.0% | 4.7%(+75.3)#1 | 3.1%(+76.9)#24 |
| 2. | 99632 | 50.0% | 4.7%(+45.3)#2 | 3.1%(+46.9)#56 |
| 3. | 99649 | 50.0% | 4.7%(+45.3)#3 | 3.1%(+46.9)#66 |
| 4. | 99519 | 24.0% | 4.7%(+19.3)#4 | 3.1%(+20.9)#296 |
| 5. | 99554 | 20.0% | 4.7%(+15.3)#5 | 3.1%(+16.9)#406 |
| 6. | 99555 | 15.4% | 4.7%(+10.7)#6 | 3.1%(+12.3)#644 |
| 7. | 99639 | 15.0% | 4.7%(+10.3)#7 | 3.1%(+11.9)#677 |
| 8. | 99840 | 14.2% | 4.7%(+9.54)#8 | 3.1%(+11.1)#748 |
| 9. | 99744 | 12.5% | 4.7%(+7.80)#9 | 3.1%(+9.40)#952 |
| 10. | 99737 | 12.0% | 4.7%(+7.28)#10 | 3.1%(+8.89)#1,004 |
| 11. | 99780 | 11.4% | 4.7%(+6.66)#11 | 3.1%(+8.26)#1,095 |
| 12. | 99568 | 11.2% | 4.7%(+6.54)#12 | 3.1%(+8.14)#1,116 |
| 13. | 99755 | 11.2% | 4.7%(+6.47)#13 | 3.1%(+8.07)#1,130 |
| 14. | 99692 | 11.1% | 4.7%(+6.41)#14 | 3.1%(+8.01)#1,141 |
| 15. | 99573 | 10.5% | 4.7%(+5.83)#15 | 3.1%(+7.43)#1,256 |
| 16. | 99712 | 10.3% | 4.7%(+5.62)#16 | 3.1%(+7.22)#1,298 |
| 17. | 99611 | 9.9% | 4.7%(+5.15)#17 | 3.1%(+6.76)#1,406 |
| 18. | 99683 | 9.7% | 4.7%(+5.02)#18 | 3.1%(+6.62)#1,434 |
| 19. | 99686 | 9.3% | 4.7%(+4.55)#19 | 3.1%(+6.15)#1,571 |
| 20. | 99631 | 9.1% | 4.7%(+4.39)#20 | 3.1%(+5.99)#1,637 |
| 21. | 99663 | 9.0% | 4.7%(+4.29)#21 | 3.1%(+5.89)#1,668 |
| 22. | 99676 | 8.9% | 4.7%(+4.18)#22 | 3.1%(+5.78)#1,707 |
| 23. | 99674 | 8.4% | 4.7%(+3.67)#23 | 3.1%(+5.27)#1,878 |
| 24. | 99660 | 8.3% | 4.7%(+3.63)#24 | 3.1%(+5.23)#1,894 |
| 25. | 99516 | 7.7% | 4.7%(+2.95)#25 | 3.1%(+4.55)#2,174 |
| 26. | 99574 | 7.6% | 4.7%(+2.88)#26 | 3.1%(+4.48)#2,206 |
| 27. | 99587 | 6.8% | 4.7%(+2.14)#27 | 3.1%(+3.74)#2,605 |
| 28. | 99709 | 6.4% | 4.7%(+1.73)#28 | 3.1%(+3.33)#2,886 |
| 29. | 99689 | 6.1% | 4.7%(+1.42)#29 | 3.1%(+3.02)#3,144 |
| 30. | 99701 | 6.0% | 4.7%(+1.34)#30 | 3.1%(+2.94)#3,224 |
| 31. | 99824 | 6.0% | 4.7%(+1.32)#31 | 3.1%(+2.92)#3,250 |
| 32. | 99577 | 6.0% | 4.7%(+1.30)#32 | 3.1%(+2.90)#3,272 |
| 33. | 99694 | 6.0% | 4.7%(+1.29)#33 | 3.1%(+2.89)#3,283 |
| 34. | 99766 | 5.9% | 4.7%(+1.18)#34 | 3.1%(+2.78)#3,380 |
| 35. | 99752 | 5.7% | 4.7%(+0.988)#35 | 3.1%(+2.59)#3,578 |
| 36. | 99508 | 5.6% | 4.7%(+0.925)#36 | 3.1%(+2.53)#3,660 |
| 37. | 99507 | 5.5% | 4.7%(+0.801)#37 | 3.1%(+2.40)#3,821 |
| 38. | 99714 | 5.5% | 4.7%(+0.794)#38 | 3.1%(+2.39)#3,829 |
| 39. | 99623 | 5.4% | 4.7%(+0.658)#39 | 3.1%(+2.26)#4,005 |
| 40. | 99581 | 5.1% | 4.7%(+0.402)#40 | 3.1%(+2.00)#4,387 |
| 41. | 99652 | 4.8% | 4.7%(+0.115)#41 | 3.1%(+1.72)#4,897 |
| 42. | 99556 | 4.8% | 4.7%(+0.084)#42 | 3.1%(+1.68)#4,960 |
| 43. | 99658 | 4.8% | 4.7%(+0.062)#43 | 3.1%(+1.66)#5,004 |
| 44. | 99678 | 4.8% | 4.7%(+0.062)#44 | 3.1%(+1.66)#5,009 |
| 45. | 99517 | 4.7% | 4.7%(-0.040)#45 | 3.1%(+1.56)#5,190 |
| 46. | 99645 | 4.6% | 4.7%(-0.102)#46 | 3.1%(+1.50)#5,328 |
| 47. | 99518 | 4.6% | 4.7%(-0.124)#47 | 3.1%(+1.48)#5,385 |
| 48. | 99762 | 4.5% | 4.7%(-0.192)#48 | 3.1%(+1.41)#5,512 |
| 49. | 99586 | 4.5% | 4.7%(-0.206)#49 | 3.1%(+1.39)#5,549 |
| 50. | 99613 | 4.4% | 4.7%(-0.304)#50 | 3.1%(+1.30)#5,769 |
| 51. | 99515 | 4.4% | 4.7%(-0.339)#51 | 3.1%(+1.26)#5,835 |
| 52. | 99603 | 4.2% | 4.7%(-0.538)#52 | 3.1%(+1.06)#6,296 |
| 53. | 99901 | 4.0% | 4.7%(-0.681)#53 | 3.1%(+0.919)#6,689 |
| 54. | 99801 | 3.9% | 4.7%(-0.817)#54 | 3.1%(+0.784)#7,103 |
| 55. | 99504 | 3.9% | 4.7%(-0.837)#55 | 3.1%(+0.763)#7,150 |
| 56. | 99688 | 3.7% | 4.7%(-1.02)#56 | 3.1%(+0.578)#7,785 |
| 57. | 99502 | 3.6% | 4.7%(-1.10)#57 | 3.1%(+0.501)#8,063 |
| 58. | 99669 | 3.6% | 4.7%(-1.10)#58 | 3.1%(+0.498)#8,073 |
| 59. | 99820 | 3.6% | 4.7%(-1.13)#59 | 3.1%(+0.472)#8,174 |
| 60. | 99612 | 3.5% | 4.7%(-1.17)#60 | 3.1%(+0.430)#8,319 |
| 61. | 99501 | 3.5% | 4.7%(-1.19)#61 | 3.1%(+0.411)#8,384 |
| 62. | 99672 | 3.5% | 4.7%(-1.22)#62 | 3.1%(+0.379)#8,515 |
| 63. | 99576 | 3.4% | 4.7%(-1.26)#63 | 3.1%(+0.339)#8,671 |
| 64. | 99654 | 3.2% | 4.7%(-1.55)#64 | 3.1%(+0.052)#9,768 |
| 65. | 99702 | 3.1% | 4.7%(-1.60)#65 | 3.1%(-0.001)#9,979 |
| 66. | 99685 | 3.1% | 4.7%(-1.61)#66 | 3.1%(-0.005)#10,001 |
| 67. | 99610 | 3.0% | 4.7%(-1.71)#67 | 3.1%(-0.107)#10,447 |
| 68. | 99929 | 2.8% | 4.7%(-1.88)#68 | 3.1%(-0.278)#11,214 |
| 69. | 99835 | 2.5% | 4.7%(-2.16)#69 | 3.1%(-0.559)#12,539 |
| 70. | 99723 | 2.5% | 4.7%(-2.16)#70 | 3.1%(-0.559)#12,540 |
| 71. | 99503 | 2.4% | 4.7%(-2.28)#71 | 3.1%(-0.676)#13,068 |
| 72. | 99833 | 2.4% | 4.7%(-2.31)#72 | 3.1%(-0.712)#13,254 |
| 73. | 99506 | 2.3% | 4.7%(-2.36)#73 | 3.1%(-0.755)#13,455 |
| 74. | 99827 | 2.0% | 4.7%(-2.65)#74 | 3.1%(-1.05)#14,897 |
| 75. | 99588 | 1.7% | 4.7%(-2.97)#75 | 3.1%(-1.37)#16,289 |
| 76. | 99615 | 1.7% | 4.7%(-3.03)#76 | 3.1%(-1.43)#16,550 |
| 77. | 99664 | 1.5% | 4.7%(-3.17)#77 | 3.1%(-1.57)#17,169 |
| 78. | 99734 | 1.5% | 4.7%(-3.23)#78 | 3.1%(-1.63)#17,426 |
| 79. | 99633 | 1.1% | 4.7%(-3.62)#79 | 3.1%(-2.02)#18,983 |
| 80. | 99705 | 1.0% | 4.7%(-3.67)#80 | 3.1%(-2.07)#19,151 |
| 81. | 99703 | 0.82% | 4.7%(-3.88)#81 | 3.1%(-2.28)#19,793 |
| 82. | 99567 | 0.41% | 4.7%(-4.29)#82 | 3.1%(-2.69)#20,774 |
Common Questions
What are the Top 10 Zip Codes with the Highest Percentage of Population with a Degree in Physical and Health Sciences in Alaska?
Top 10 Zip Codes with the Highest Percentage of Population with a Degree in Physical and Health Sciences in Alaska are:
What zip code has the Highest Percentage of Population with a Degree in Physical and Health Sciences in Alaska?
99675 has the Highest Percentage of Population with a Degree in Physical and Health Sciences in Alaska with 80.0%.
What is the Percentage of Population with a Degree in Physical and Health Sciences in the State of Alaska?
Percentage of Population with a Degree in Physical and Health Sciences in Alaska is 4.7%.
What is the Percentage of Population with a Degree in Physical and Health Sciences in the United States?
Percentage of Population with a Degree in Physical and Health Sciences in the United States is 3.1%.